


Frame useful reporting questions
Translate a management or team question into defined measures, dimensions, time periods, audiences and decision boundaries before asking AI to assist.
This proposed course helps Malaysian manufacturing and office teams turn structured operational data into clearer charts, dashboards and business reports with AI-assisted analysis. Learners practise defining KPIs, checking data quality, explaining trends and obtaining human approval using fictional or sanitised examples.
Proposed course outline; tools, dates, format, duration and fees must be confirmed with AIGreen Plus.

AI data analytics training Malaysia can help teams use AI to support data preparation, chart selection, KPI interpretation and management reporting. This proposed course uses fictional or sanitised manufacturing and business datasets. Participants check every visual and interpretation against its source, record assumptions and obtain authorised review before sharing or acting on an insight.
This is a proposed training outline, not a confirmed schedule or a promise of commercial results. Use fictional or approved examples and keep decisions with the responsible people.
Learning objectives describe practice, not guaranteed business results.
Translate a management or team question into defined measures, dimensions, time periods, audiences and decision boundaries before asking AI to assist.
Identify missing values, inconsistent labels, duplicate records, unusual observations and unclear definitions in fictional or sanitised datasets before visualisation.
Select suitable chart forms, structure a KPI view and draft a concise explanation that separates observed facts, possible interpretations and questions for owners.
Trace figures to approved sources, protect sensitive information, document assumptions and obtain authorised approval before distributing or acting on an AI-assisted report.
Prompt → Check → Revise → Review
Use AI to support suitable tasks. Manufacturing, quality, safety and business decisions remain with the people responsible.
Course visuals are AI-created fictional scenes; people and facilities do not depict actual AIGreen Plus staff, learners or client events.
A team uses sanitised monthly output, downtime, first-pass yield and inspection-observation data to draft charts and a management narrative. AI assists with structure and questions, while production and QA/QC owners verify figures, definitions and any follow-up before circulation.
Fictional receiving discrepancies, stock-location notes, supplier lead times and purchase-order cycle times are organised into an exception view. Participants trace each quantity to its source, distinguish missing data from delay, and obtain authorised review before operational action.
An office team prepares a sanitised monthly pack covering service requests, document turnaround and meeting actions. AI helps draft chart commentary for different audiences, but staff check dates, counts, context and commitments against approved records before sharing.
Examples are fictional or sanitised proposals, not AIGreen Plus client case studies or verified results.
These points describe AIGreen Plus's proposed approach for this course, not an independent competitor comparison or a claim that other providers do not offer similar content. Confirm the syllabus, tools, delivery scope and availability with AIGreen Plus.
| Potential point of difference | AIGreen Plus's approach | Why it may matter to a factory |
|---|---|---|
| Reporting-question first | The proposed learning path starts with audience, KPI definitions, source boundaries and decision ownership before chart or AI prompting practice. | Teams can focus on reports that answer a real operations, quality, warehouse, procurement or office question rather than producing visuals without purpose. |
| Manufacturing and office context | Exercises use fictional or sanitised examples spanning production, QA/QC, warehouse, procurement and routine business reporting. | Participants can connect visualisation choices and narrative checks to familiar Malaysian SME workflows while avoiding exposure of live records. |
| Evidence before explanation | The proposed method separates verified observations, possible interpretations, data limitations and actions requiring an owner. | Reviewers have a clearer way to challenge unsupported trends, causal claims, unusual figures and ambiguous KPI definitions. |
| Governance built into practice | Each exercise includes source traceability, privacy boundaries, human review, approval and a small-pilot mindset rather than unattended reporting. | Organisations can discuss a responsible adoption path, subject to their policies, authorised owners and confirmation of suitable tools and availability. |
On small screens, scroll horizontally inside the table to compare all three columns.
Eight proposed modules are shown in a structured table for easy review. Confirm the final syllabus, depth, tools, duration and delivery format with AIGreen Plus.
On small screens, scroll horizontally inside the course outline table to see every column.
| Module | Focus | Key points | Practice exercise |
|---|---|---|---|
| 01Reporting questions, data boundaries and responsible AI | Set a sound starting point for AI-assisted visualisation by defining the business question, audience, source boundary and human decision owner. |
| Using a fictional Malaysian factory KPI request, convert a vague management question into a reporting brief with audience, measures, source boundaries, review owner and unresolved questions. |
| 02Data preparation and quality checks for reporting | Prepare structured data for analysis while making definitions, gaps and anomalies visible before a chart or narrative is produced. |
| Audit a sanitised production-and-warehouse dataset containing inconsistent product labels and missing dates; create a data-quality log and a human-approved cleaning plan without inventing values. |
| 03KPI definitions and metric design | Make operational and office KPIs interpretable by documenting formulas, denominators, ownership, frequency and legitimate comparison periods. |
| For fictional on-time delivery, first-pass yield and purchase-order cycle-time data, draft a KPI dictionary with formula, unit, frequency, owner and known limitations, then request owner review. |
| 04Chart selection and visual design | Choose visual forms that make comparisons, change over time, distributions and exceptions easier to inspect without overstating what the data shows. |
| Given four fictional reporting questions from operations, QA/QC, procurement and administration, propose a chart for each, explain the choice and mark any visual-risk concern for review. |
| 05AI-assisted trend and exception analysis | Use AI to surface patterns and questions from reviewed data while separating observed movements from hypotheses about causes. |
| Analyse a fictional monthly scrap-rate and downtime table with an AI prompt; compare its observations with the source, remove unsupported causal claims and produce follow-up questions for production and QA/QC owners. |
| 06Dashboard structure and management reporting | Organise a reviewable dashboard or report page that moves from headline indicators to context, exceptions, actions and source notes. |
| Design a one-page fictional monthly operations report for a Malaysian SME, placing KPI cards, trend charts, exception notes and source caveats in a logical reading order before a manager reviews it. |
| 07Narrative reporting and stakeholder communication | Turn verified visual findings into concise, audience-appropriate business commentary for management, team meetings and cross-functional follow-up. |
| From a fictional dashboard and meeting brief, draft separate management, shop-floor and procurement updates; verify every number, qualify uncertainty and assign only actions supported by the source. |
| 08Review, governance and a safe reporting pilot | Create a repeatable review path for AI-assisted reports and plan a small, low-risk pilot with clear ownership and evaluation questions. |
| Write a pilot brief for a fictional weekly warehouse exception report, including scope, approved inputs, safeguards, reviewer, sign-off record, feedback questions and stop conditions. |
It is a proposed practical course on using AI to support data preparation, KPI definition, chart selection, trend review and business-report drafting. Human verification and authorised approval remain essential, and final syllabus details should be confirmed with AIGreen Plus.
It is intended for Malaysian manufacturing and office teams such as operations, planning, QA/QC, warehouse, procurement, business analysis and administration staff who prepare or review recurring reports.
The proposed modules cover reporting questions, data-quality checks, KPI definitions, chart selection, dashboard structure, trend and exception analysis, narrative commentary and review governance.
AI can suggest options, but the reporting owner must define the KPI, confirm its formula and select a chart appropriate to the audience and decision. Suggestions require human review against approved sources and organisational practice.
Yes. Proposed exercises use fictional or sanitised examples from production, QA/QC, warehouse receiving, procurement lead times, office administration and management reporting. The examples do not represent client evidence or guaranteed results.
Learners log missing, duplicate, inconsistent or estimated values, trace figures to the source, test generated claims and flag unresolved issues. AI output is a draft; a responsible person approves any report before use.
The draft does not promise a particular software product, plan feature or account access. Confirm current vendor capabilities, organisation-approved tools, permissions and availability with AIGreen Plus before delivery.
Use fictional or sanitised information unless the organisation has explicitly approved a specific data use. Do not share personal, customer, supplier, proprietary or otherwise restricted data with an AI tool without following organisational policy.
No. It provides a proposed learning framework and review practices, not a guarantee of accuracy, savings, rankings, compliance or business outcomes. Data owners and authorised professionals retain responsibility for decisions and approvals.
Confirm the proposed syllabus, tools, account arrangements, delivery format, language, availability, duration, fees and any certificate or HRD Corp arrangements. Do not send confidential factory or business data in an enquiry.
How can Malaysian manufacturing and office teams pilot AI-assisted data visualisation and business reporting safely?
For AI data analytics training Malaysia, a practical starting point is a fictional or sanitised reporting task such as a production, warehouse or office KPI pack. Define measures and boundaries, check data quality, document assumptions, verify charts and commentary against approved sources, and obtain authorised human approval before a small, measured pilot.
A practical course proposal. Select approved tools and sample data under your organisation's policy; keep operational, safety, quality and other authorised decisions with the responsible people.

Bound a reporting question, audience and human decisions.
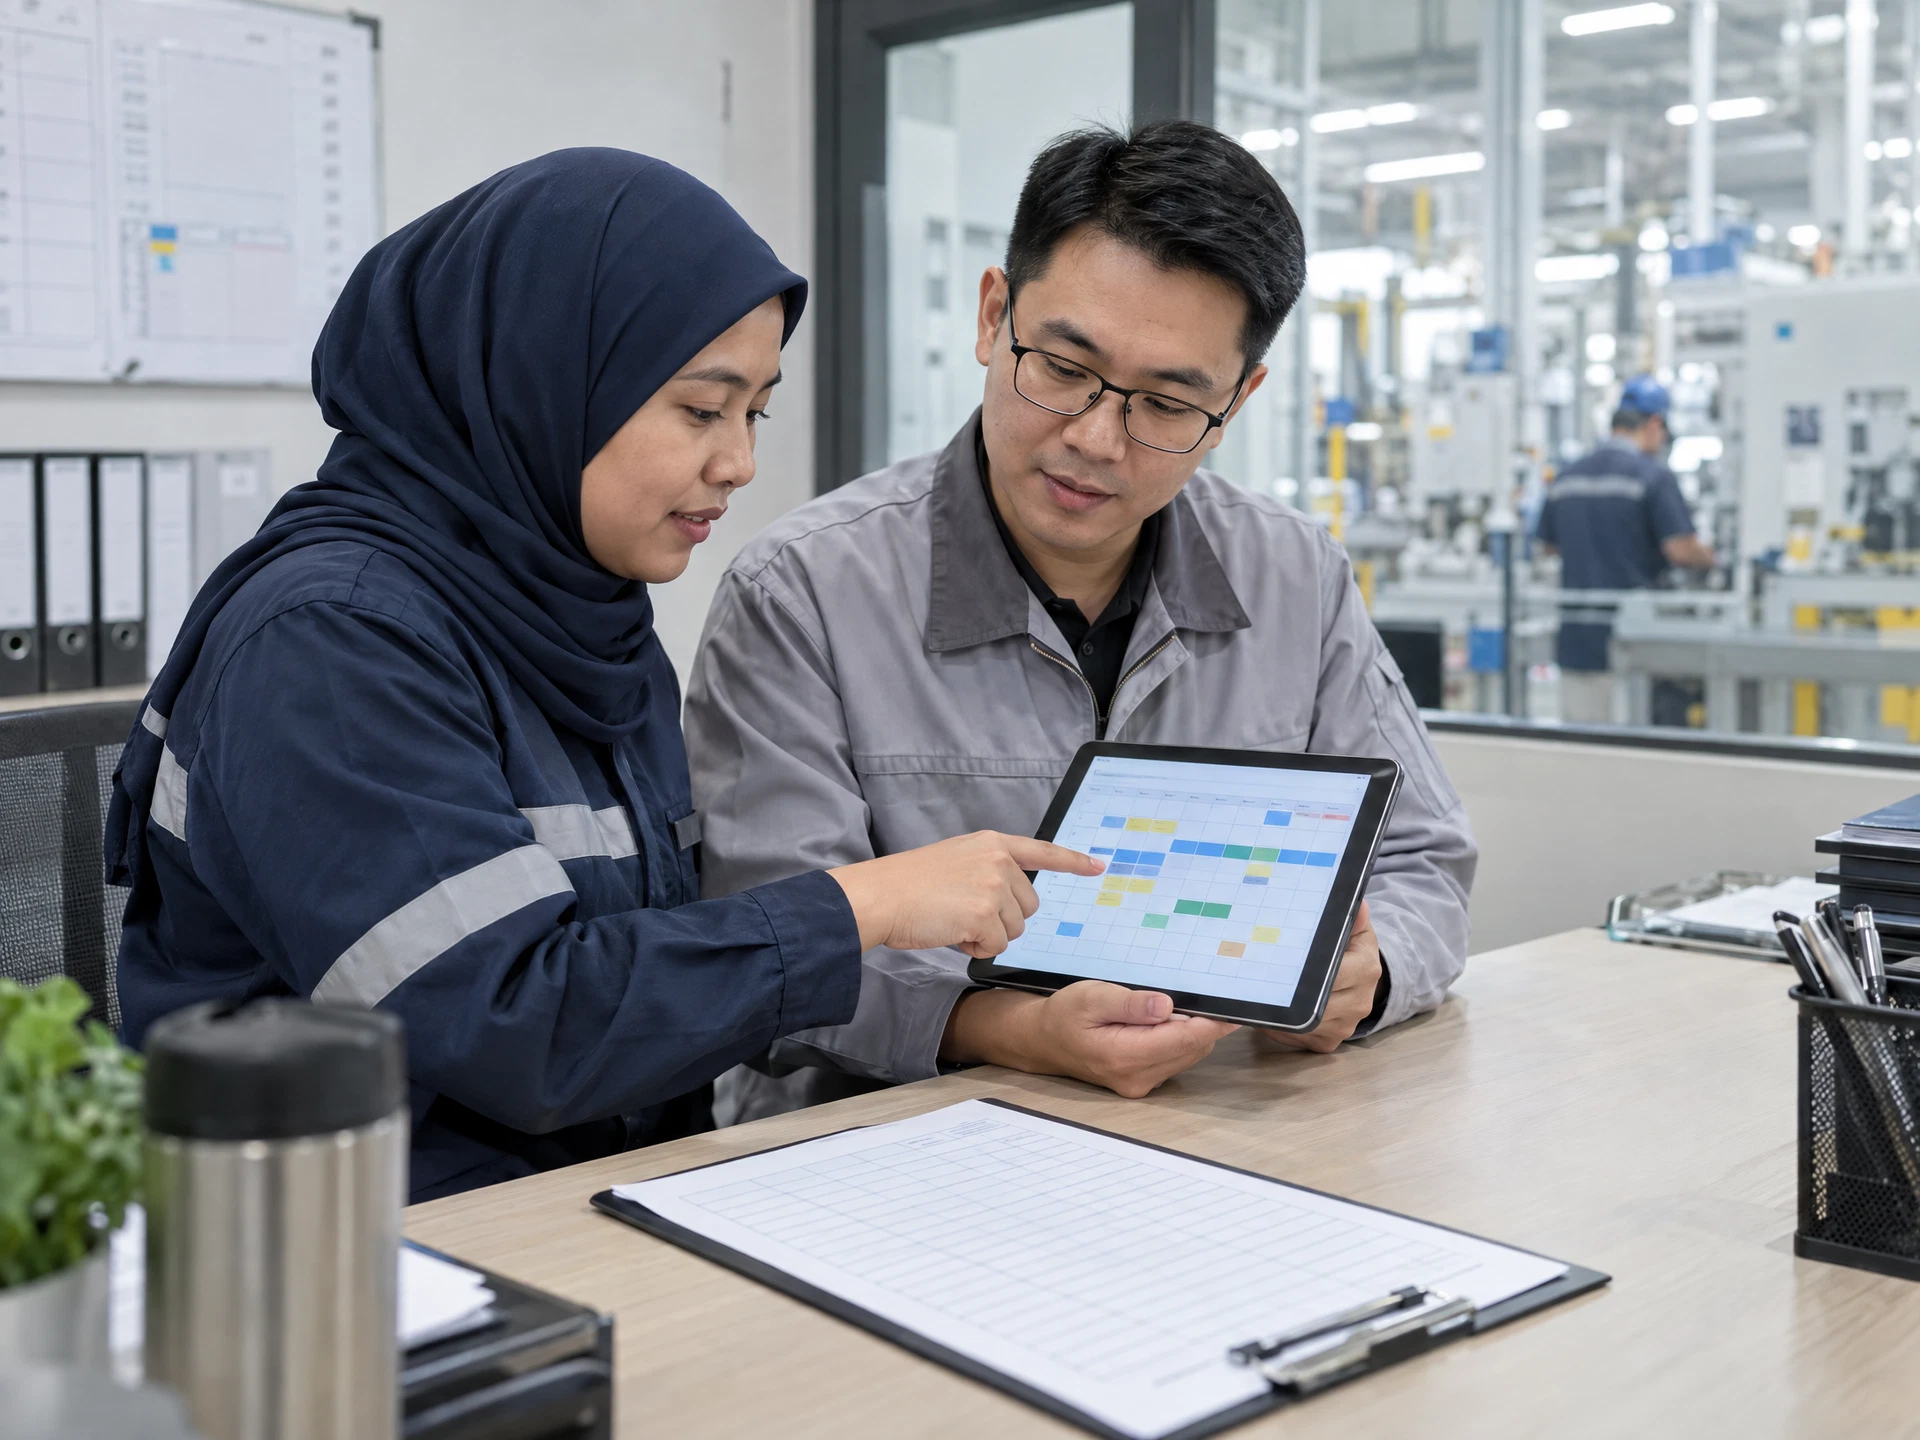
Prepare inspectable data and clearly defined KPI calculations.

Make comparisons, trends and exceptions clear through visual reporting.
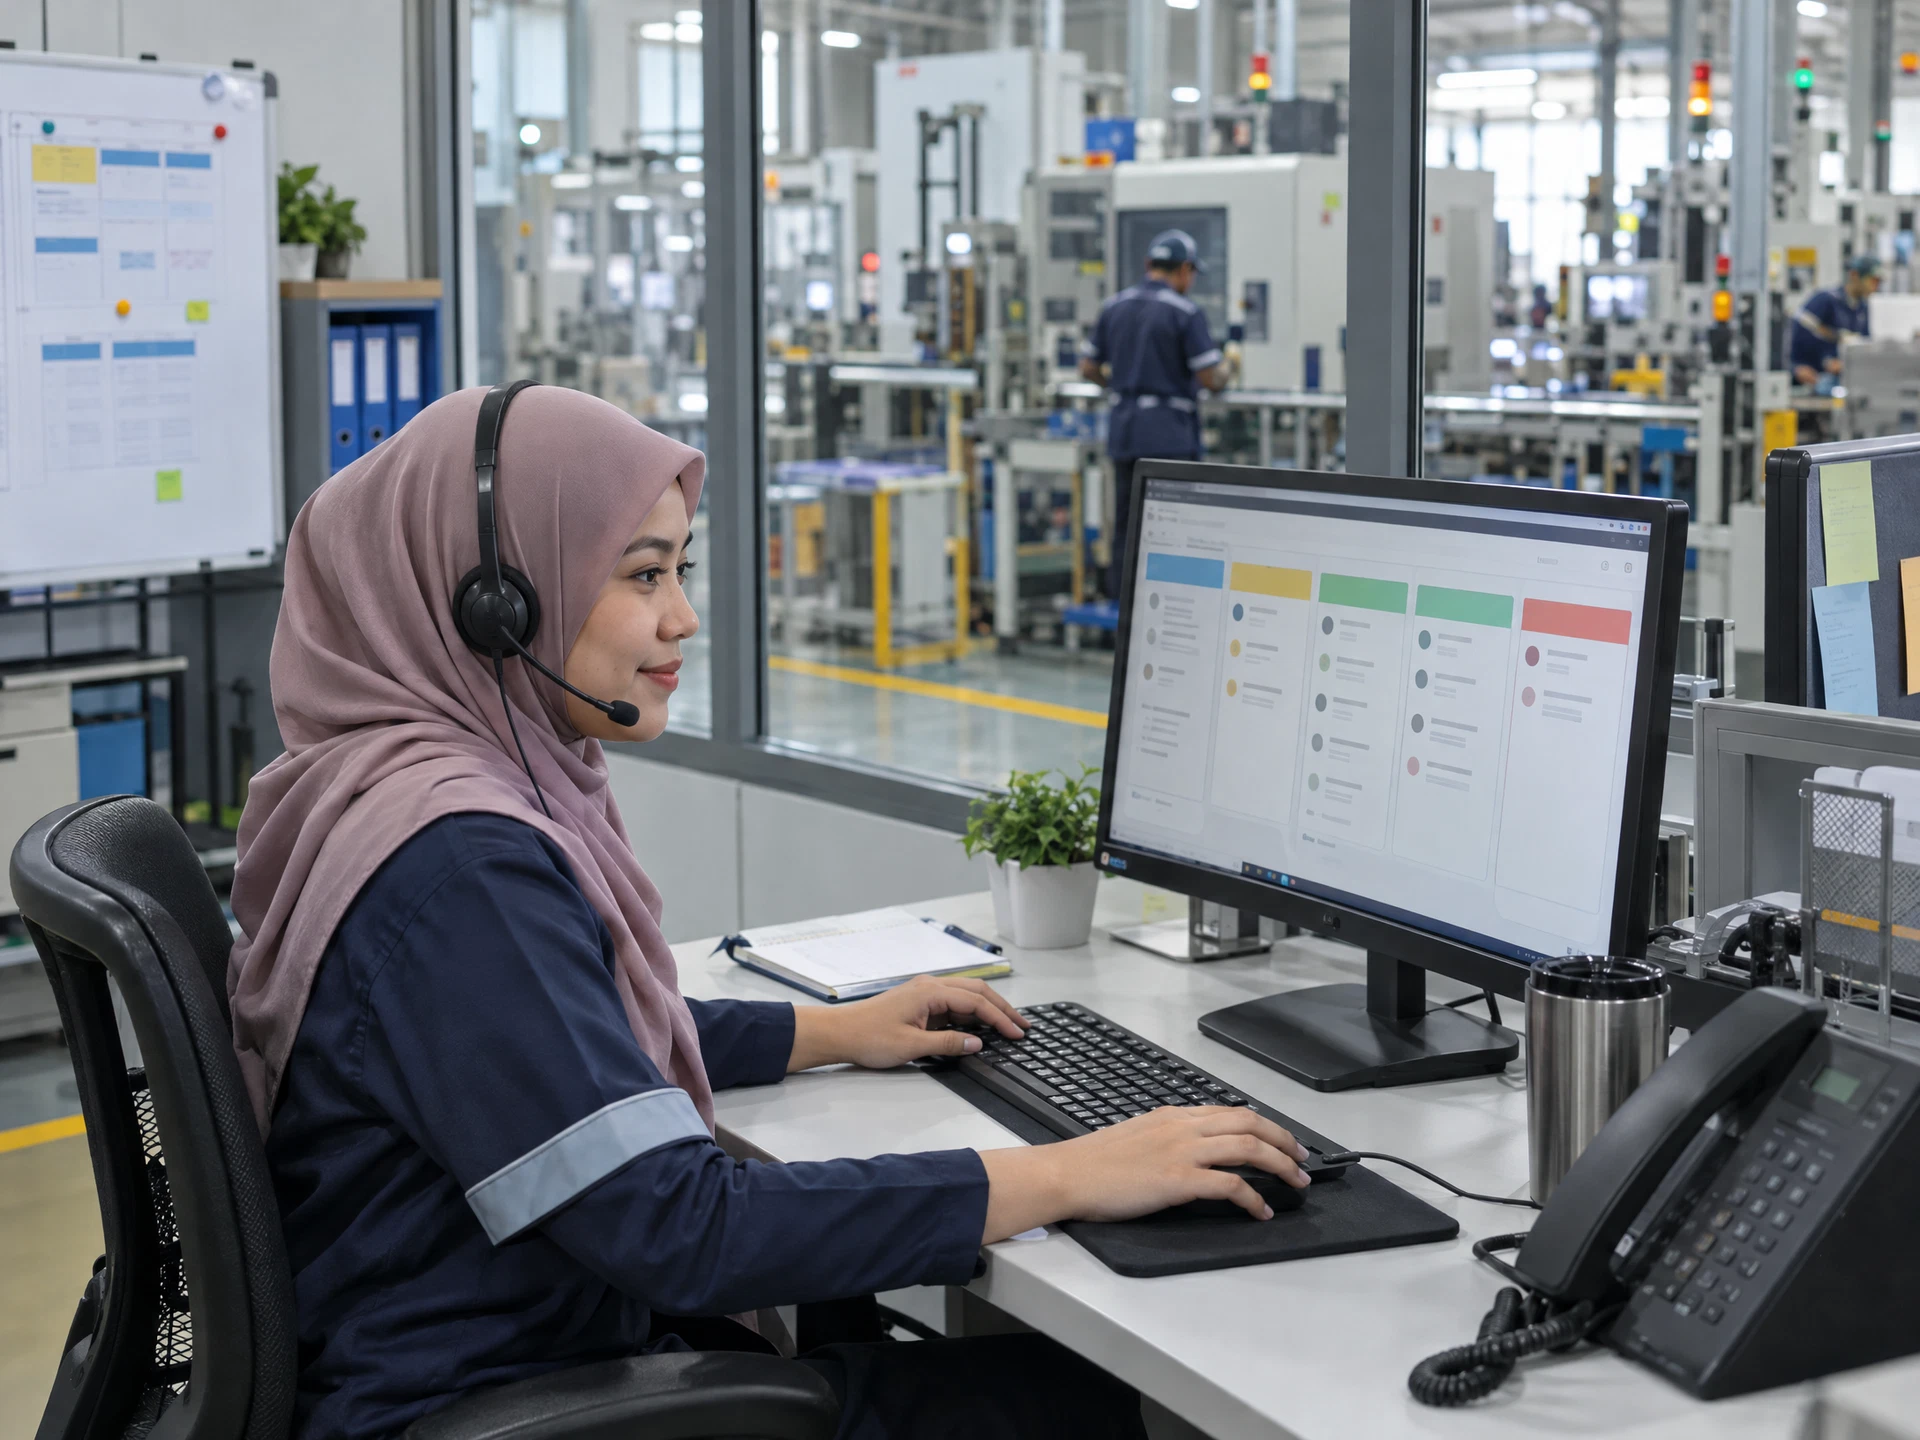
Verify figures and claims through competent human review.

Evaluate a controlled pilot and decide subsequent controls.
Use the materials with a competent workplace owner and the appropriate approvals.
The five-stage flow uses AI-created fictional scenes; the people, equipment, interfaces and facilities are not actual AIGreen Plus staff, learners, clients or factories. Course images are category-specific examples. Pending assets are labelled in progress; unavailable artwork is suppressed rather than replaced with unrelated imagery.
Share the course title, participant roles and learning priorities. AIGreen Plus will confirm syllabus, tools, availability, delivery language, format and quotation.
Do not send confidential production data, account details or personal information in an enquiry.
