


Map energy data flows
Create a factory energy map linking major loads, meters, gateways, data owners, production drivers and the boundary of a proposed monitoring exercise.
Digital ESG, AI & Emerging Topics
A practical course for Malaysian manufacturing SMEs to connect meters, machine data and human review into a usable energy picture. Participants map energy-consuming processes, check IIoT data quality, distinguish energy and emissions evidence, and design proportionate monitoring and action loops without promising savings, certification or instant decarbonisation.
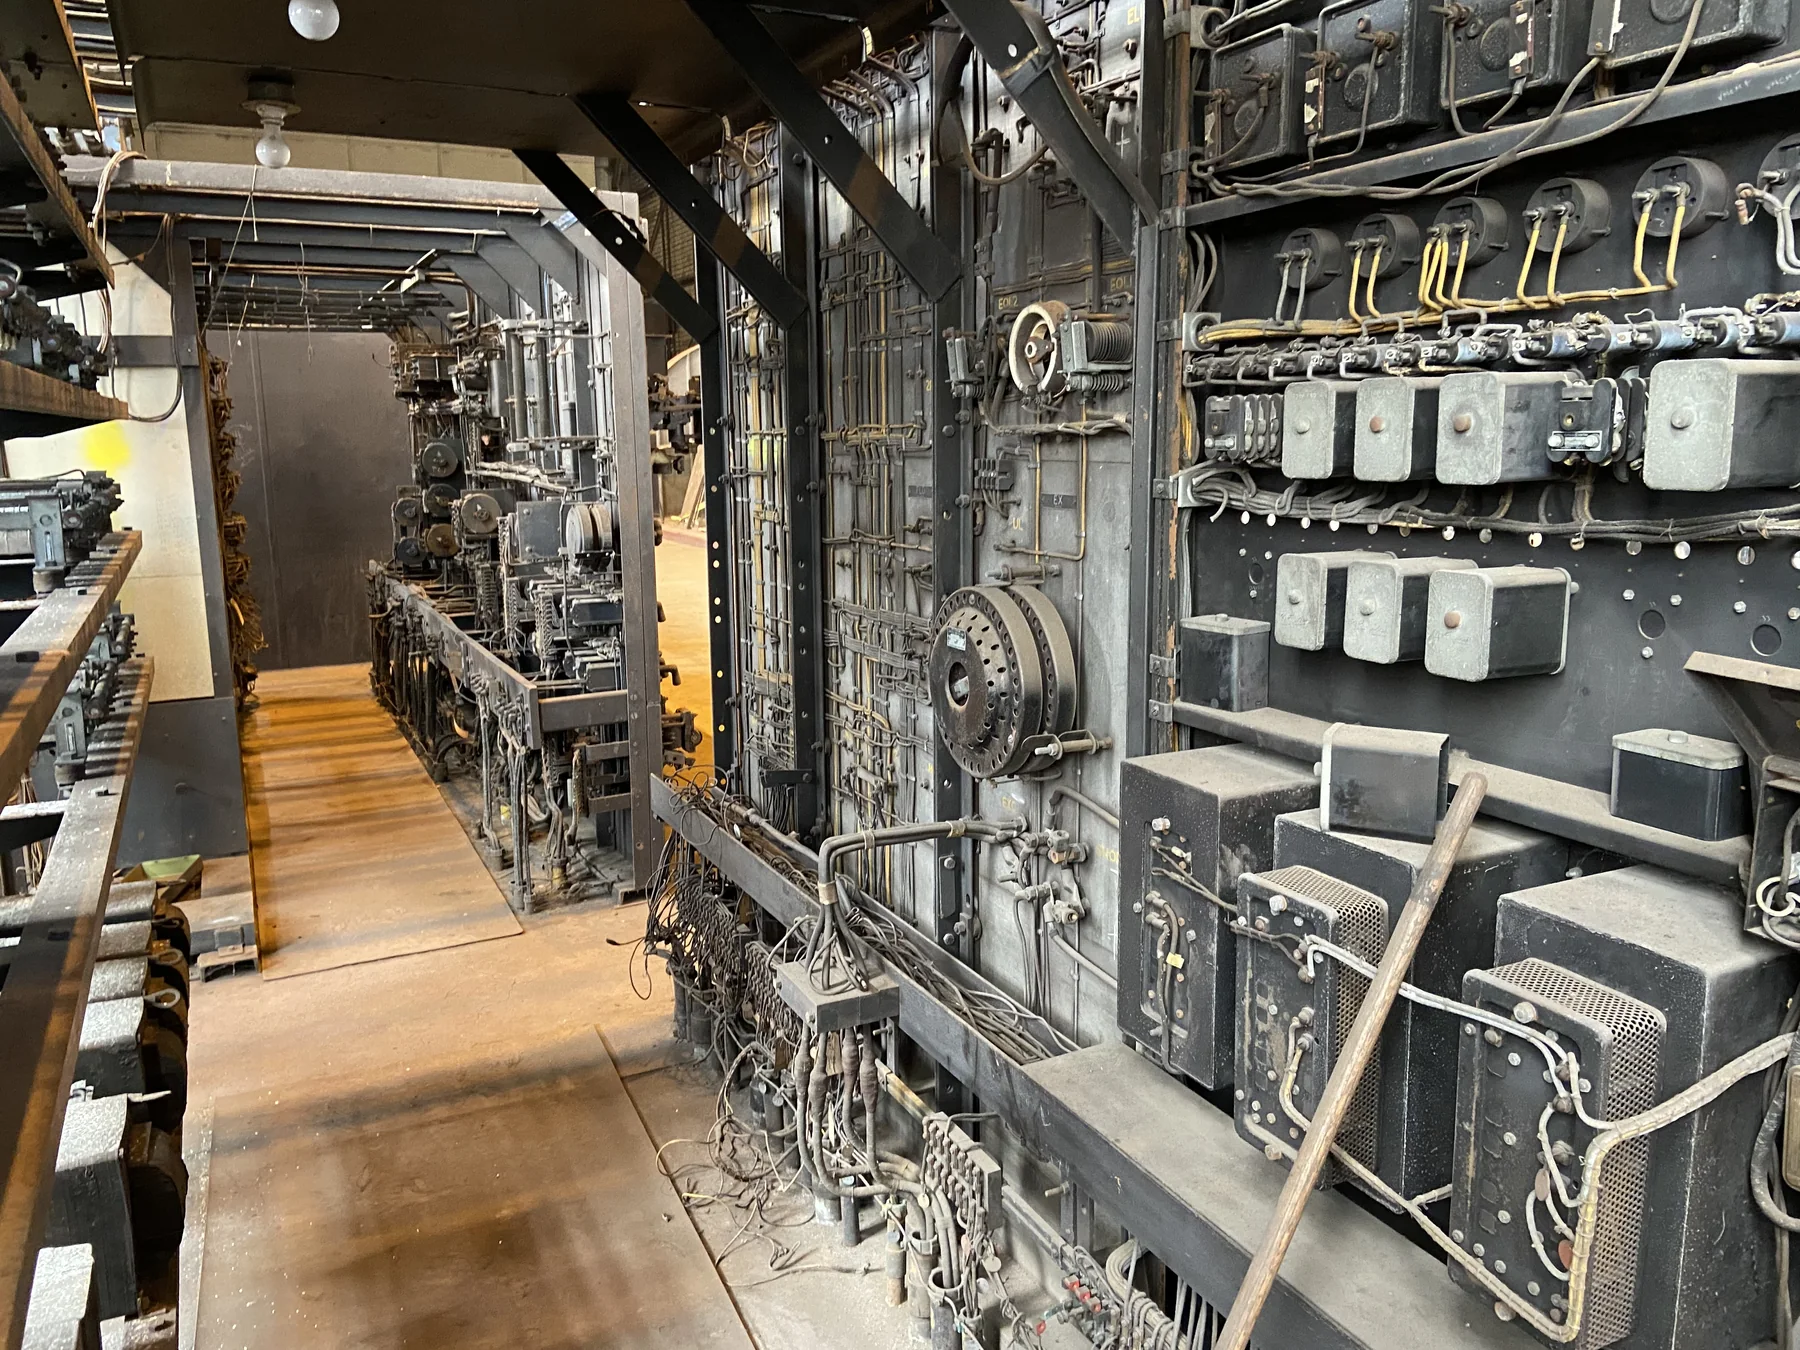
Category covers and course photos are illustrative licensed photographs, not AIGreen Plus staff, facilities or client results. Required creator and licence credits appear with each course photograph.
Use this three-lens check to move from a connected reading to a proportionate learning question without skipping evidence review.
| Decision / evidence | MeasureWhat was observed | InterpretWhat gives it context | ActWhat is reviewed next |
|---|---|---|---|
| Boundary | Named load, fuel or meter point | Process, shift and period are stated | Owner confirms the intended question |
| Data quality | Unit, timestamp and interval are visible | Missing or estimated readings are labelled | Follow-up check is assigned before action |
| Operating context | Reading is linked to a measured stream | Production or weather context is considered | Operator or maintainer supplies a check |
| Response | Signal is recorded without embellishment | Possible causes are ranked for review | Action, evidence and review date are drafted |
A connected reading is not by itself proof of a GHG reduction, cost saving, compliance position or assurance conclusion. Course content is educational; verify current requirements against the linked official sources and the organisation's circumstances.
This course teaches factory teams how industrial IoT devices, meters, gateways and dashboards can support energy monitoring and GHG-reduction planning. Participants practise defining boundaries, selecting useful energy performance indicators, checking timestamps and units, investigating anomalies, and linking evidence to operational actions. It serves Malaysian manufacturing SME owners and cross-functional operations, maintenance, engineering, finance and sustainability roles. The outputs are fictional data maps, review prompts and a scoped action plan, not measured client results or certification.
Create a factory energy map linking major loads, meters, gateways, data owners, production drivers and the boundary of a proposed monitoring exercise.
Apply practical checks for timestamps, units, missing intervals, meter hierarchy, access controls and contextual notes before treating a reading as decision-ready evidence.
Use a simple baseline and energy performance indicator to investigate unusual patterns while separating measured energy information from later emissions calculations.
Prepare a scoped monitoring and response plan with owners, review prompts, data-quality checks and evidence boundaries rather than promising savings or verified reductions.
A fictional moulding team groups machine, chiller, compressor and lighting readings under a simple meter hierarchy. Participants add production batches and operating shifts, record the data owner for each stream, and mark missing intervals. They then draft questions for a review meeting without describing the exercise as measured savings or a completed emissions reduction.
Using sanitised mock information from a food-processing site, learners compare electricity readings with production batches and refrigeration operating periods. They document the selected boundary, unit, data gaps and assumptions, then investigate an unusual weekend pattern. The exercise demonstrates disciplined interpretation; it does not establish a verified baseline, financial return or carbon result.
A fictional metal fabricator plans a gateway for welding bays and compressed air. The group sketches the device-to-dashboard path, assigns access roles, tests a sample timestamp sequence and prepares an operator response card. The output is a classroom design and evidence checklist, not an implementation, cybersecurity assessment or assurance conclusion.
This is a fictional learning example, not client results, a measured emissions reduction or a recommendation to operate equipment in a particular way.
Stated basis: Same compressor zone, product family and reviewed production window · 100 ÷ 100 and 80 ÷ 100.
Absolute difference: 0.2 kWh per 100 kg finished product / denominator unit. This is a comparison of the stated exercise values, not proof of improvement.
The renderer compares two hypothetical readings on a common basis as a simple exercise; it does not attribute any difference to training or establish a GHG reduction.
The comparison does not prove carbon reductions, cost savings, compliance, certification, assurance or financing eligibility.
Final depth, exercises and delivery details are confirmed with AIGreen Plus before delivery.
On a small screen, scroll horizontally inside the course-outline table.
| Module | Focus | Key points | Practice |
|---|---|---|---|
| 01Factory Energy and GHG Links | Trace electricity and fuel flows from factory activities to monitoring points, while distinguishing measured energy data from later emissions calculations. |
| Map a fictional plastics factory's loads, meters, production drivers and records before identifying evidence that remains unavailable or estimated. |
| 02IIoT Architecture and Sensors | Compare meters, sensors, gateways, protocols, historians and dashboards as an evidence chain suited to a smaller manufacturing site. |
| Choose a simple monitoring architecture for a fictional injection-moulding line with limited budget, mixed equipment and a remote dashboard requirement. |
| 03Data Quality and Governance | Set data boundaries and quality checks so readings remain traceable, comparable and usable for decisions without hiding missing or estimated values. |
| Audit a sanitised meter export, flag gaps and duplicates, then create a short data-quality log with owners and follow-up questions. |
| 04Baselines and Energy Indicators | Build a transparent baseline and energy performance indicators using production context, operating periods and stated assumptions rather than unsupported improvement claims. |
| Create a baseline table for a fictional metal-stamping line using meter readings, batch counts, operating hours and clearly labelled assumptions. |
| 05Anomalies and Load Priorities | Use interval patterns and operator context to triage unusual consumption, equipment drift and avoidable idle loads for human investigation. |
| Review a mock compressor time series with an overnight spike, then prepare an investigation card listing checks, witnesses and supporting records. |
| 06From Signals to GHG Actions | Translate a verified monitoring signal into proportionate operational, maintenance or capital questions while keeping reductions unmeasured until evidence supports them. |
| Build a response card for a fictional nighttime load, covering operator checks, maintenance questions, decision owner and later measurement needs. |
| 07Cybersecurity and Adoption | Plan access, retention, network separation and human review so connected monitoring supports operations without exposing sensitive factory or personal information. |
| Assess a fictional IIoT rollout for access, retention and network risks, then assign mitigations without using personal or commercially sensitive data. |
| 08Review, Roadmap and Boundaries | Create a management review rhythm linking data quality, actions and learning, while separating training exercises from assurance, certification or site audit. |
| Present a six-week fictional pilot outline with scope, review gates, participant outputs and a clear boundary against certification or assurance. |
This draft uses meter-to-decision exercises and factory examples; it describes course design, not proven superiority, client results or guaranteed emissions reduction.
| Focus | Proposed approach | Factory relevance |
|---|---|---|
| Evidence-chain thinking | Learners connect load, meter, gateway, timestamp, owner and review question before interpreting a signal. | Manufacturers can see where a useful reading may be lost, altered or misunderstood. |
| SME-sized deployment | Exercises stage monitoring around material loads and decisions instead of assuming a complete factory-wide platform. | Smaller teams can discuss scope, effort and evidence needs before selecting equipment or software. |
| Human-in-loop review | Every alert or unusual pattern is paired with an operator check, contextual note and accountable follow-up owner. | Factory knowledge helps distinguish a data fault from a real process question without automatic intervention. |
| Claims boundary | Exercises keep meter readings, energy indicators, GHG calculations and public claims as separate review steps. | Teams can avoid presenting a connected dashboard or classroom exercise as proof of reduction or certification. |
It covers factory energy mapping, connected meters and gateways, data quality, baselines, energy performance indicators, anomaly review, cybersecurity boundaries and action planning. Exercises use fictional or sanitised manufacturing information so participants can practise a traceable monitoring approach without presenting training work as a measured result.
The course suits owners and plant leaders plus operations, engineering, maintenance, facilities, IT, automation, finance, quality and sustainability roles. A cross-functional group is useful because energy data, production context, equipment knowledge, access controls and any later GHG calculation may sit with different people.
Connected meters, sensors, gateways, data services and dashboards can help collect, organise and review energy information. They do not remove the need for clear boundaries, quality checks, human interpretation, secure access or accountable operational decisions. The course treats IIoT as an evidence chain, not an automatic emissions solution.
No. A dashboard can make patterns easier to review, but a factory still needs to investigate causes, decide on an appropriate response, implement any approved measure and gather suitable evidence. This course does not promise savings or reductions, and it does not turn a classroom comparison into a verified result.
Energy readings are activity information that may support a later emissions calculation when the boundary, period, units, method and relevant factors are established. The course keeps monitoring evidence separate from that calculation and does not prescribe a current regulatory method, filing position or emissions factor.
Useful approved samples may include utility bills, interval meter exports, equipment lists, production counts, shift schedules, maintenance notes and existing data dictionaries. Remove personal, confidential and commercially sensitive details. Fictional, anonymised or sanitised records are entirely suitable when live information is not approved for learning use.
No. ISO describes ISO 50001 as an energy management system framework involving policy, objectives, data-informed decisions, measurement, review and continual improvement; certification is possible but not obligatory. This course uses related learning concepts, but it is not certification, implementation assurance or an ISO audit.
Participants practise checking meter identity, boundary, unit, timestamp, interval, missing or duplicated readings, estimates, production context and data ownership. They record gaps instead of guessing, then draft follow-up questions. The checklist is a learning aid and does not certify a live system's accuracy, security or completeness.
Exercises discuss role-based access, device and gateway boundaries, retention, network separation, credential handling and human review. Participants use approved or sanitised examples and avoid personal data. The course does not perform a penetration test, approve a production architecture or replace the organisation's own security and privacy controls.
Dates, duration, delivery format, tools, materials and fees are not fixed in this draft. Please enquire with the course title, participant roles, factory context and learning priorities so the available scope and quotation can be confirmed. No funding, certificate or results claim is implied by this course content.
Greenhouse Gas Emissions Reduction Through Industrial IoT and Smart Energy Monitoring — proposed practice flow; people remain responsible for evidence, decisions and any operational change.
 Photo: Tim Witzdam · Pexels License (free commercial use) · Image resized and converted to WebP.
Define the factory load, energy stream, production context and learning question before selecting data.
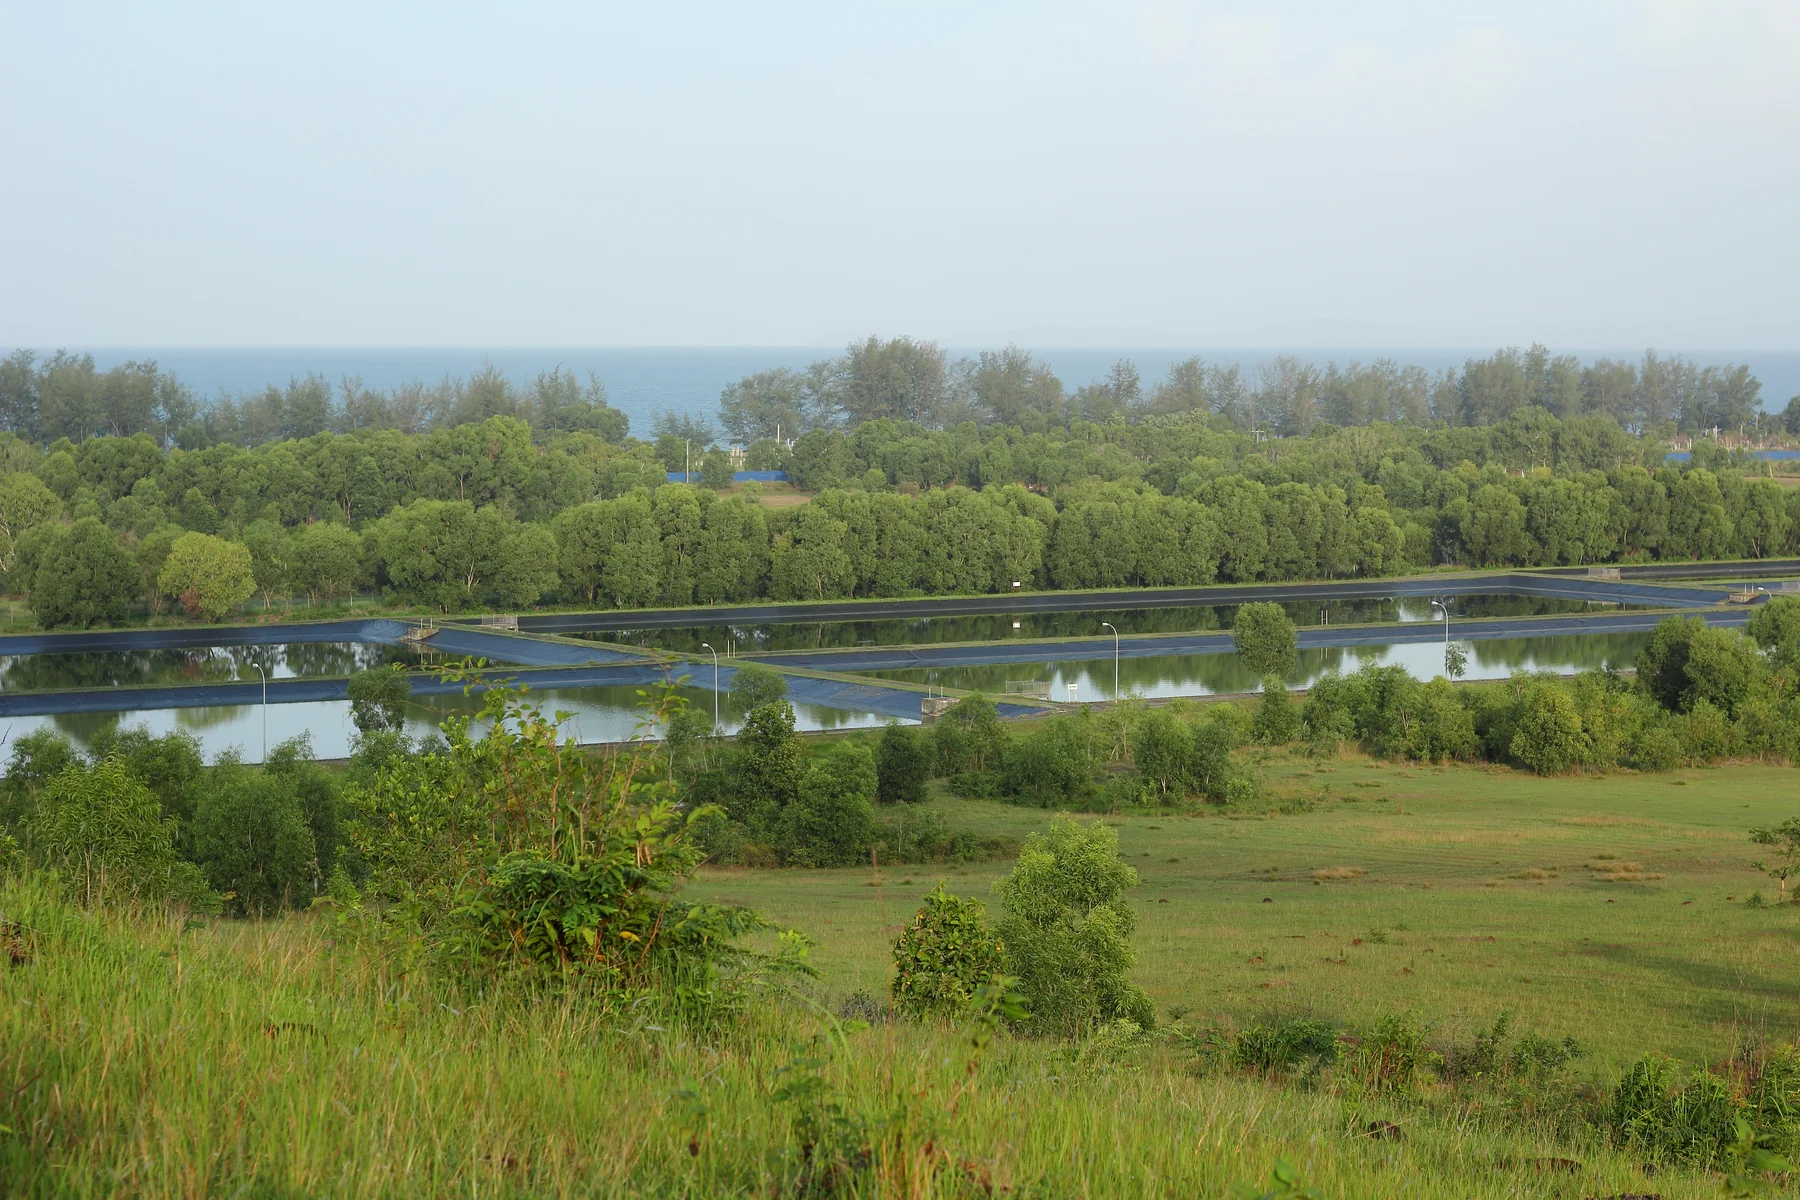 Photo: Dmitry Makeev (Knopik-som) · Creative Commons Attribution-ShareAlike 4.0 International (CC BY-SA 4.0) · Image resized and converted to WebP; this adaptation is shared under CC BY-SA 4.0.
Sketch meters, sensors, gateways, storage, dashboards and people involved in the proposed evidence chain.
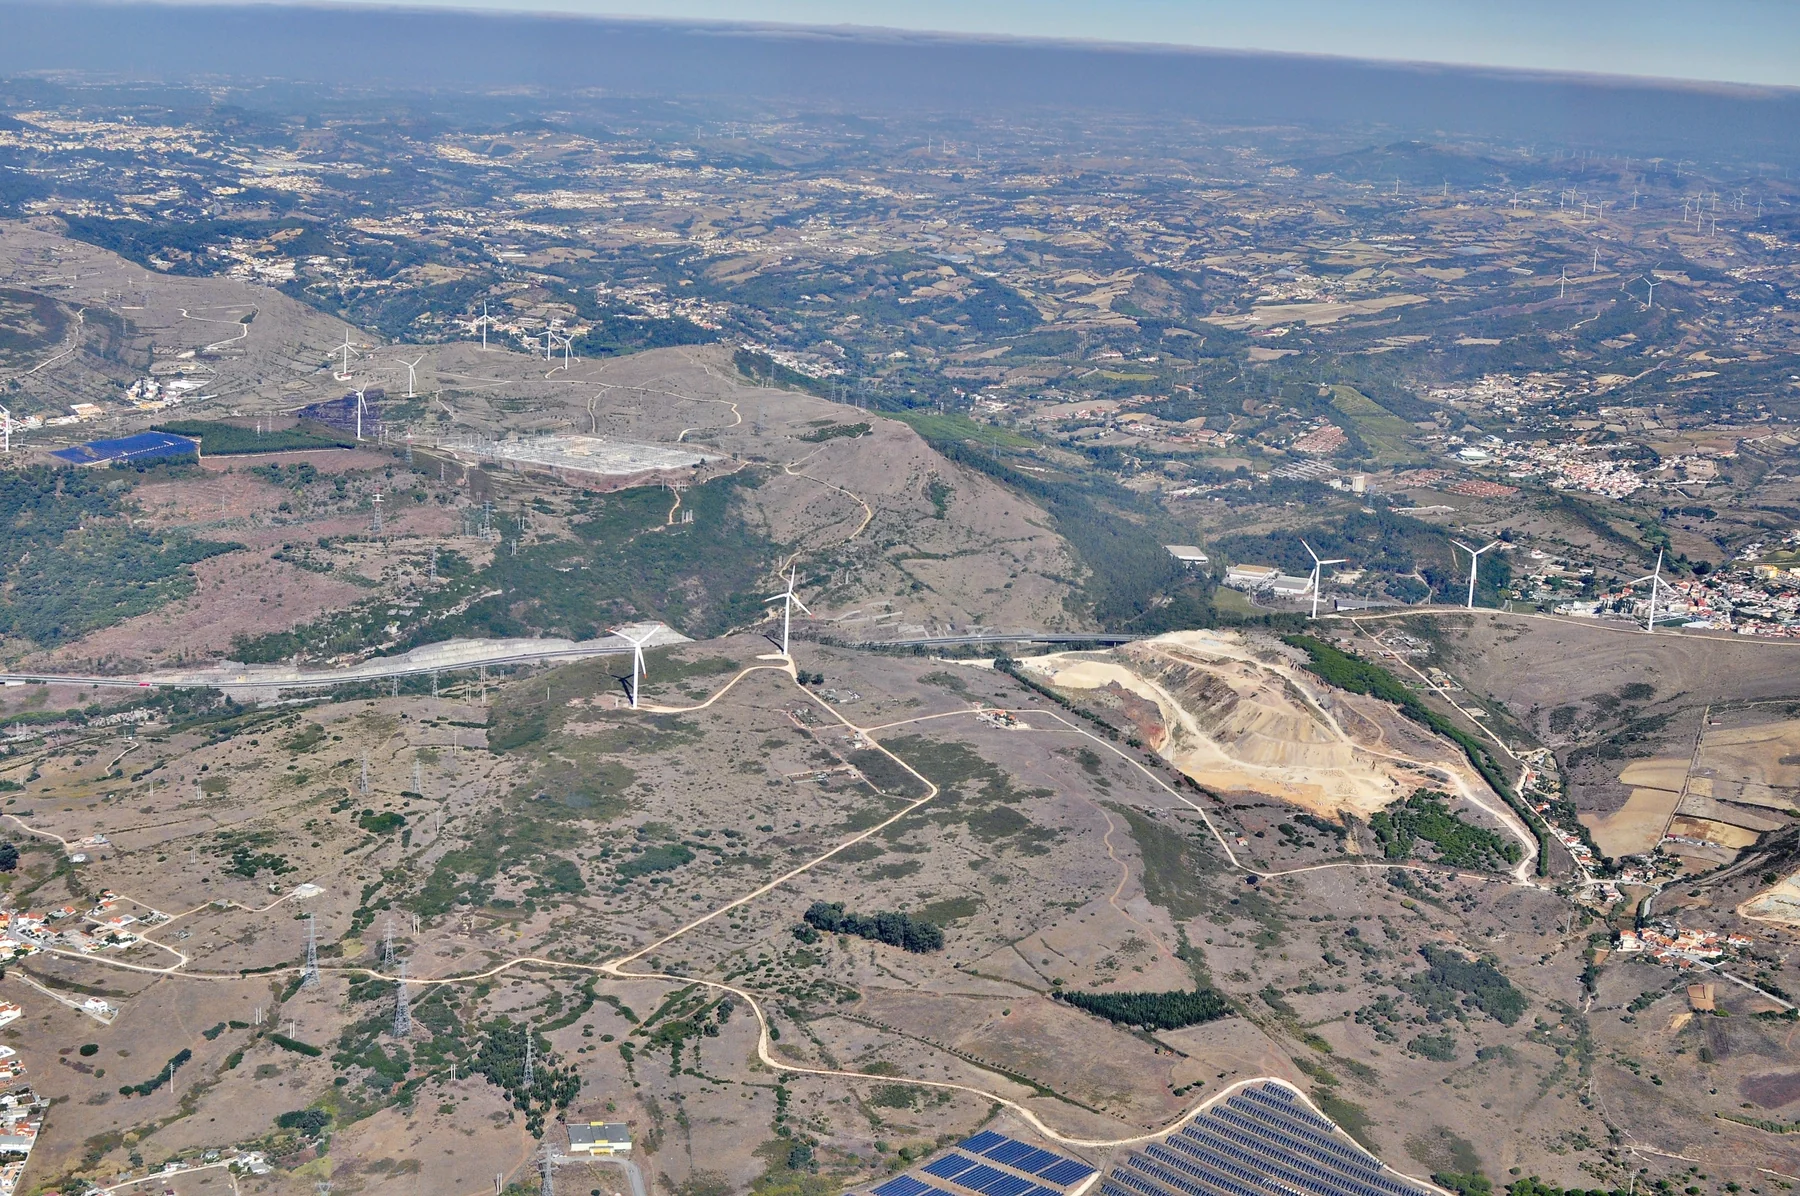 Photo: Pedro Mendes (Flickr user pedrik) · Creative Commons Attribution 2.0 Generic (CC BY 2.0) · Image resized and converted to WebP.
Practise checking units, timestamps, intervals, missing values and contextual records with approved sample data.
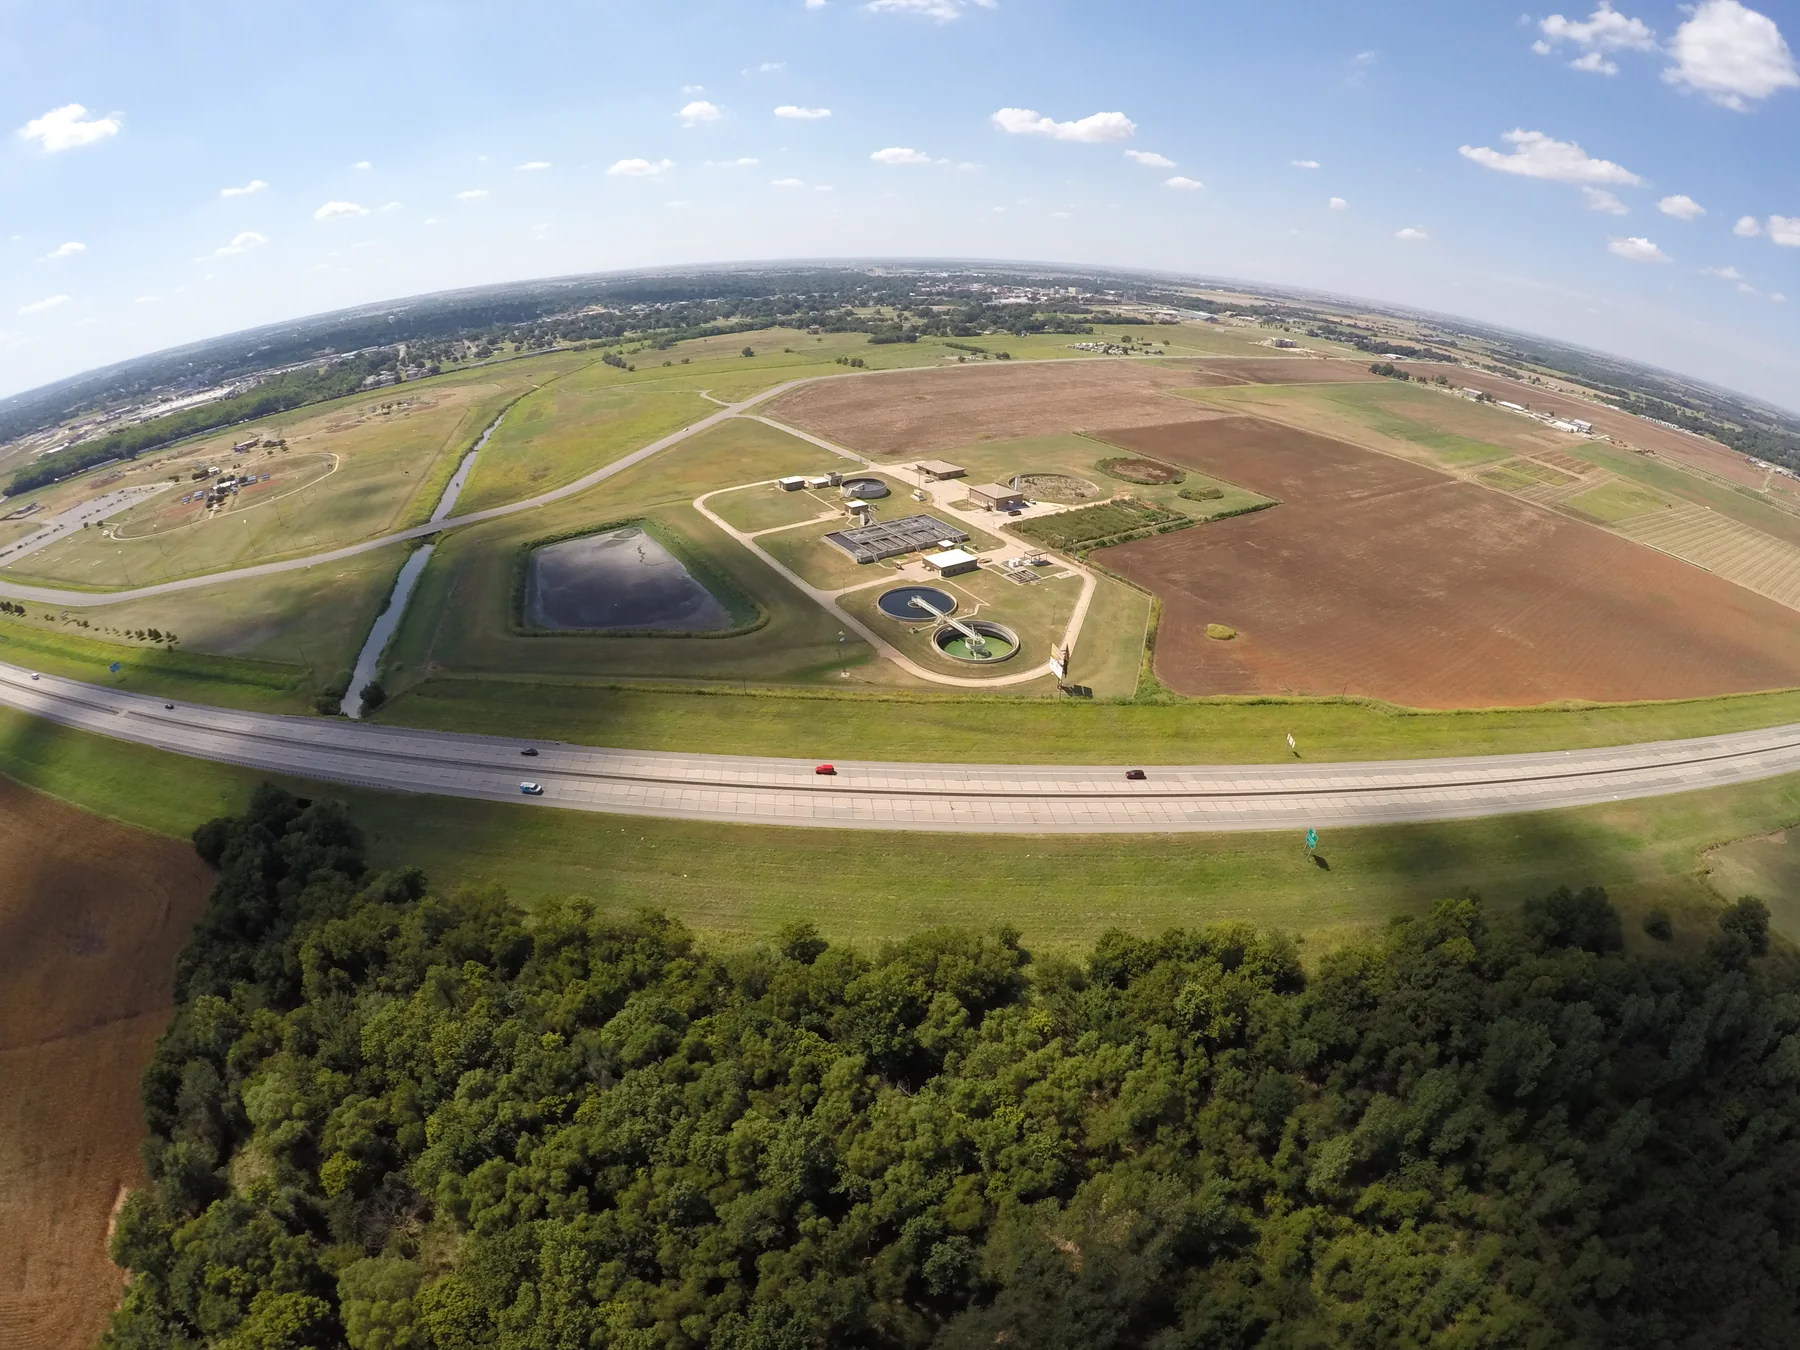 Photo: Environmental Health Program / USGS (photographer not individually named) · U.S. Public Domain (USGS Sources/Usage: Public Domain) · Image resized and converted to WebP.
Use a simple baseline or indicator to discuss unusual patterns with an accountable operator or maintainer.
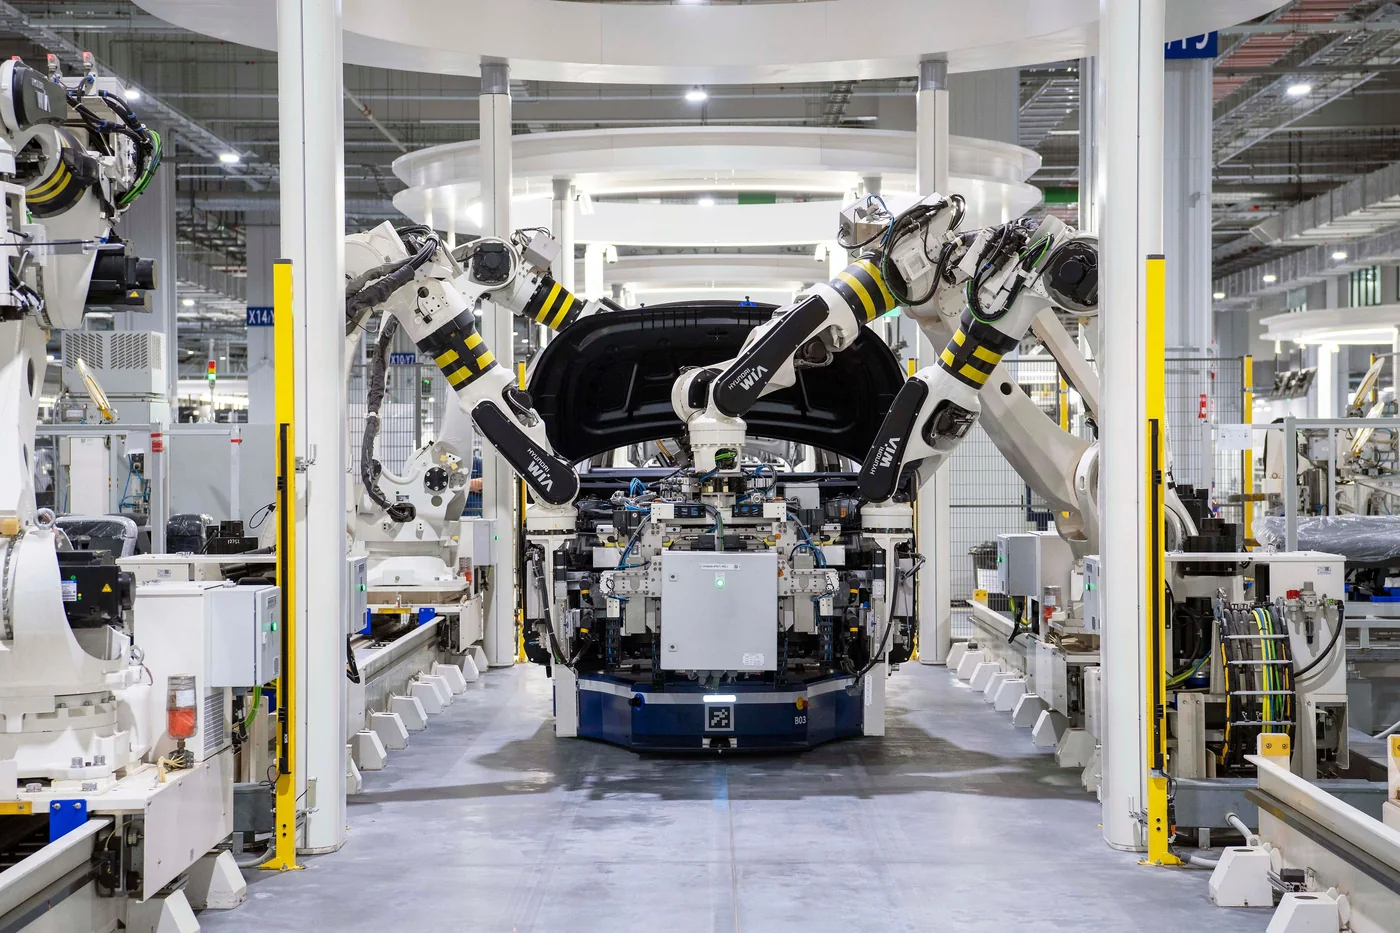 Photo: Hyundai Motor Group · Pexels License · Image resized and converted to WebP.
Draft proportionate next steps and evidence gates while reserving any reduction claim for later substantiation.
Human review: The comparison does not prove carbon reductions, cost savings, compliance, certification, assurance or financing eligibility.
Confirm the final syllabus, duration, dates, format and fees for your manufacturing team.
