


GREEN BUILDING & ESG DIGITALISATION
ESG Data Management and Carbon Reporting Dashboard
Turn scattered activity records into a reviewable carbon reporting view. Keep every conclusion human-approved.
AIGreen Plus can scope a consultancy-led data model, evidence register and dashboard concept around your plant boundaries and reporting needs. We map source records, document assumptions and prepare review packs; we do not present a pre-installed application, certified inventory or automatic compliance result.
Human review retainedCurrent-source check is conditionalFictional dashboard concept
See the review dashboard ↓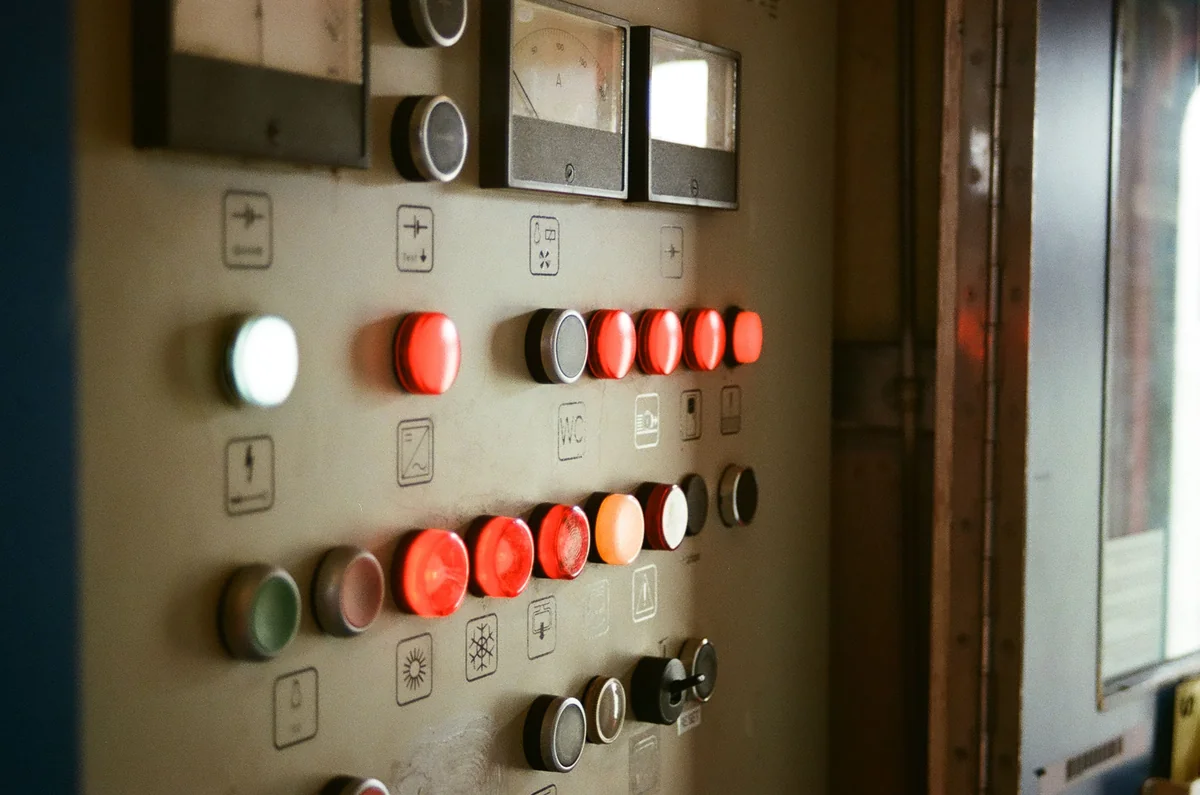
Photo by Maartje Eyskens · Source: source page · Licence: Pexels License · Resized proportionally and converted to WebP; original content retained. Displayed in a landscape frame.
This service helps Malaysian manufacturers organise activity data for a proposed ESG and carbon reporting dashboard. The work can structure Scope 1, Scope 2 and relevant Scope 3 records, test completeness, document factor provenance and surface exceptions for review. Outputs are a scoped data dictionary, sample dashboard, reconciliation notes and handover pack. Client owners and qualified reviewers approve boundaries, factors, calculations and disclosures; AIGreen Plus does not make legal or tax determinations.
01 / SEE THE REVIEW OUTPUT
Illustrative Carbon Data Readiness Dashboard
FICTIONAL SAMPLE / one monthly reporting-period intake review. This screen is a static illustration for discussion, not a connected customer system.
PROPOSED DASHBOARD CONCEPT
FICTIONAL SAMPLE / one monthly reporting-period intake reviewIllustrative Carbon Data Readiness Dashboard
Expected source records by reporting group
Fictional sample values · Bars compare fictional expected record volumes, not emissions, performance or reduction outcomes.
Unit: records
| Record group | Expected records | Evidence-ready records | Gap records |
|---|---|---|---|
| Scope 1: fuels and refrigerants | 12 | 9 | 3 |
| Scope 2: purchased electricity | 8 | 7 | 1 |
| Scope 3: selected value-chain categories | 15 | 9 | 6 |
| Emission-factor register | 10 | 8 | 2 |
AI-assisted draft / requires verification
The fictional intake shows the largest follow-up queue in selected Scope 3 categories, followed by the factor register. A reviewer should validate boundary, category selection, source documents and factor versions before any emissions figure or disclosure is approved.
02 / FIVE REVIEW STAGES
Five steps, with an accountable owner.
Evidence, assumptions and open questions move through a human review route. No certification or automatic conclusion is implied.
- 01↓
Scope and boundaries
Agree entity, sites and reporting periodDocument organisational boundary, included facilities, reporting period, intended audience and exclusions before collecting figures.
OWNER / CONTROLClient sponsor / qualified ESG reviewer - 02✓
Data structure
Design the proposed record schemaDefine Scope 1, Scope 2 and relevant Scope 3 categories with fields for activity, units, quantities, factors, evidence and reviewer status.
OWNER / CONTROLConsultant with data owners - 03≡
Evidence and analysis
Reconcile sources and assumptionsMap invoices, meter records, fuel logs, procurement data and factor references into a traceable sample and identify gaps or estimation choices.
OWNER / CONTROLData owners / consultant analyst - 04◎
Qualified review
Challenge factors and calculationsFacilitate review of boundaries, units, factor source/version/date, exclusions and draft totals without treating the dashboard as assurance.
OWNER / CONTROLClient-authorised reviewer / external adviser where required - 05↗
Handover and roadmap
Leave a controlled reporting methodDeliver the agreed dashboard concept, issue log, data dictionary, review checklist and next-cycle improvement roadmap.
OWNER / CONTROLConsultant and nominated client owner
If a check fails: Hold the record for its owner, correct the source and preserve the approved manual fallback.
03 / RESPONSIBILITIES
Organise the work. Keep conclusions with people.
The proposed support can structure records and questions; responsible owners still assess evidence, applicability and decisions.
| Review point | Common starting position | Proposed consultancy support | Responsible reviewer |
|---|---|---|---|
| Collect monthly activity evidence | Email, spreadsheet and folder review across sites | Proposed structured intake and status view within an agreed tool or workbook | Data owners confirm source documents, units and period |
| Maintain factor provenance | Recheck factor files and notes each reporting cycle | Proposed factor register with source, version, date and reviewer fields | Qualified reviewer selects and approves applicable factors |
| Reconcile Scope 1–3 records | Compare ledgers, meters, invoices and procurement extracts | Proposed completeness and exception views using agreed rules | Finance, operations and sustainability resolve exceptions |
| Prepare a reporting pack | Copy figures into narrative and disclosure templates | Proposed traceable summary and evidence-index draft | Authorised management approves wording, figures and release |
Create one review trail
Propose a consistent record structure linking each activity quantity to evidence, owner, period and review status.
Make assumptions visible
Maintain factor source, version, date, unit and applicability notes so reviewers can challenge them.
Prioritise follow-up
Use completeness and exception views to focus meetings on missing or inconsistent records rather than unstructured chasing.
Repeat a controlled cycle
Hand over a documented monthly or periodic process that can be tested and amended with client approval.
04 / HONEST HYPOTHETICAL FIGURES
Show the working behind a planning example.
These figures are modest arithmetic for discussion, not customer evidence, forecasts, emissions claims, payroll promises or guaranteed outcomes.
HYPOTHETICAL WORKED EXAMPLE / NOT CUSTOMER RESULTS
90 → 60 combined labour minutes for the same task.
24 one monthly source-record reconciliation batch units per month × 30 minutes less per unit.
12 → 5 per 100 checked error-affected administrative entries, not incidents/accidents/disease/product defect outcomes (7.0 percentage points).
See assumptions and calculations
| Measure | Illustrative calculation | Meaning and limit |
|---|---|---|
| Labour effort | (90 − 60) ÷ 90 × 100 = 33.3% | Same workload and expected review quality; includes ongoing exception checks as scoped. |
| Time capacity | (90 − 60) × 24 ÷ 60 = 12.0 hours | Released time is not payroll savings or guaranteed job reduction. |
| Admin checks | (12 − 5) ÷ 100 = 7.0 percentage points; 58.3% relative | Separate hypothetical like-for-like administrative check of 100 entries before and after a documented method; the figures are illustrative assumptions, not benchmark performance or a guarantee. |
Hypothetical same-workload comparison: a client coordinator spends 90 minutes gathering and checking one batch, while a scoped template and dashboard view could reduce the administrative pass to 60 minutes, including consultant/client review and exception effort. It is not a headcount, payroll, emissions or energy-saving estimate.
Scenario figures are illustrative arithmetic, not benchmarks, forecasts, actual customer results or guarantees. Measure a like-for-like pilot with the same definitions before making a claim.
05 / PROPOSED DELIVERY
Agree the evidence and review route before work starts.
Boundary workshop
Clarify sites, sources, reporting period, users, intended disclosure and exclusions.
What you receiveApproved scope note and boundary decision logSchema and evidence map
Design the proposed fields and map source owners, units, factor references and review states.
What you receiveData dictionary and evidence-request registerSample dashboard review
Build a fictional or anonymised sample view, reconcile selected records and discuss exceptions.
What you receiveDashboard concept, reconciliation notes and open-issues queueHandover roadmap
Document operating roles, approval checkpoints, repeatable checks and possible future integrations for separate scoping.
What you receiveHandover pack and prioritised next-cycle roadmap06 / BEFORE YOU INVEST
Inputs, boundaries and ownership should be clear.
These lists are a starting point. Final scope, access, professional responsibility and outputs require written agreement.
What to prepare
- Site and organisational boundary list from the client sustainability sponsor
- Fuel, refrigerant and stationary/mobile combustion records from operations or facilities
- Electricity and purchased-energy invoices or meter summaries from facilities and finance
- Procurement, freight, waste, travel or supplier activity records for selected Scope 3 categories from procurement and finance
- Approved emission-factor references and calculation assumptions from the qualified reviewer
What to agree in writing
- This is scoped consultancy and a dashboard concept, not a software product already installed; interfaces, hosting, licences and integrations require written scope.
- Each proposed record should capture scope and category, activity/source, selectable unit, activity quantity, emission factor and factor unit such as kgCO2e/unit, factor source/version/date, reporting period, evidence and reviewer.
- Scope 1, Scope 2 and selected Scope 3 applicability, boundary choices and methods remain client-approved and may require qualified Malaysian legal, tax or technical advice; no regulatory conclusion is supplied.
- Access is limited to agreed, anonymised or approved business records; retention, permissions, confidentiality controls and any supplier data sharing are agreed separately.
- The dashboard is not certified assurance, external verification, an emissions-reduction promise or a claim of headcount, energy or carbon savings; management owns final signoff.
Make activity, units and evidence easy to check.
Scope and category are proposed classification fields. Confirm organisational and operational boundaries first; the same activity must not be counted twice across sources. Scope 3 relevance and calculation methods require screening, not automatic selection.
Direct emissions within the agreed boundary
- Stationary combustion
- Mobile combustion
- Process emissions
- Fugitive emissions / refrigerants
Purchased or acquired energy
- Electricity
- Steam
- Heating
- Cooling
Other value-chain emissions
- Screen the fifteen categories below
- Record the chosen method and estimation basis
- Keep upstream/downstream and lease boundaries consistent
Scope 3 category reference — fifteen categories to screen
- 01Purchased goods and services
- 02Capital goods
- 03Fuel- and energy-related activities (not included in Scope 1 or Scope 2)
- 04Upstream transportation and distribution
- 05Waste generated in operations
- 06Business travel
- 07Employee commuting
- 08Upstream leased assets
- 09Downstream transportation and distribution
- 10Processing of sold products
- 11Use of sold products
- 12End-of-life treatment of sold products
- 13Downstream leased assets
- 14Franchises
- 15Investments
Category names follow GHG Protocol — Scope 3 Calculation Guidance (read 2026-10-22). The official public guidance lists fifteen Scope 3 categories and category-specific calculation methods. The list is a screening reference, not a finding that every category applies to a manufacturer.
| Field group | Example contents / selections | Review check |
|---|---|---|
| Record identity | Site/entity, reporting period, activity owner and source record ID | Keep the agreed boundary and period consistent. |
| Activity/source | Fuel invoice, electricity meter, shipment, supplier record or process record | Identify the evidence and whether the value is measured or estimated. |
| Quantity and selectable unit | Examples: litres, kg, kWh, km, tonne-km or units of product | Choose a unit appropriate to the method; do not interchange units without a documented conversion. |
| Emission factor and factor unit | Numeric factor field; example unit kgCO₂e/kWh or kgCO₂e/litre | No default or approved factor is supplied here. The factor denominator must match the activity unit. |
| Factor provenance | Source, version/year, publication date, geography, gas/GWP basis and method | Qualified reviewers approve applicability, conversion and any licensed factor data. |
| Evidence and reviewer | Document reference, estimation basis, data-quality flag, owner and approval status | Trace each calculation to approved records and retain unresolved exceptions. |
Optional fleet, maps and IoT feasibility
Fleet telematics, route/map services and meter or sensor data may be assessed later. Provider/API rights, devices, calibration, coverage, timestamps, quality, privacy, access security, compatibility and cost need discovery and written agreement. This website does not track vehicles, read sensors or collect live customer data.
This is an educational proposal panel, not a form, upload feature, factor database, live integration or calculated emissions result. Numerical dashboard values elsewhere are fictional; approved source data and qualified review are required for an actual engagement.
Confidence comes from traceable evidence.
Set definitions, boundaries, source ownership and review responsibility before interpreting a result. A qualified responsible person decides whether a finding is applicable.
07 / CLEAR ANSWERS
10 questions. Practical answers.
Clear answers
Frequently asked questions.
Ten practical answers about scope, sources, review and responsible use.
What does the ESG data management and carbon dashboard service actually produce?
It can produce a boundary note, proposed Scope 1–3 data schema, evidence register, factor-provenance fields, sample dashboard, reconciliation notes, exception queue and handover roadmap. The result is a consultancy deliverable and review aid, not a certified inventory or pre-installed software application.
What information should a Malaysian manufacturer prepare first?
Start with site and organisational boundaries, reporting period, fuel and refrigerant records, electricity invoices or meter summaries, and selected procurement, freight, waste or travel data. Each record should identify source, unit, quantity, factor and factor provenance, evidence, period and reviewer.
Which method or standard would the work use?
The method is agreed during discovery. The GHG Protocol Corporate Standard supports corporate inventory accounting and Scope 2 guidance covers purchased electricity, steam, heat and cooling. Its Scope 3 Standard covers value-chain categories. Applicability and any reporting programme requirement must be confirmed for the organisation and period.
Who approves the boundary, factors and final reporting figures?
Named client data owners provide records, while an authorised sustainability, finance or technical reviewer approves boundaries, factors, assumptions and disclosure wording. AIGreen Plus can facilitate review and document decisions, but does not replace management accountability or an independent assurance provider.
Does the illustrative scenario mean we will cut headcount or payroll cost?
No. The scenario only illustrates possible administrative time to gather and check the same volume of records, including review and exceptions. It is not a staffing, payroll, productivity, energy or carbon-saving forecast. If useful, the client can measure actual cycle time against an agreed baseline after implementation.
Are the dashboard numbers actual emissions or customer results?
No. All displayed rows, counts and scenario figures are fictional and designed to show coherent dashboard mechanics. They are not customer evidence, approved emission factors, measured emissions, benchmark performance or a promised outcome. Actual reporting requires client records and qualified review.
How are confidentiality and access handled?
Access, anonymisation, retention, permitted users and any supplier-data sharing are agreed before work begins. Share only the least necessary business records through the approved channel. AIGreen Plus can document controls, but this page is not a legal, cybersecurity or Malaysian regulatory compliance determination.
Can this work use our existing spreadsheets, ERP or utility systems?
Possibly, subject to discovery, export quality, permissions and written scope. Existing-system feasibility can be assessed without implying a built-in connector. Vehicle tracking, maps and IoT collection are optional integration topics; they are not assumed to operate as part of this service.
How long does a dashboard engagement take?
Timing depends on site count, boundary decisions, data availability, factor review, stakeholder calendars and access approvals. We do not promise a fixed duration here. A scoped plan can set milestones after the initial discovery and identify client dependencies, review gates and any external adviser input.
What affects a quotation and what support continues afterwards?
Scope, number of sites and categories, data condition, workshops, dashboard format, system feasibility, review depth and handover needs affect a quotation. Recurring refreshes, training or support are separate written options with agreed ownership, response terms and access; 24/7 support is not implied.
START WITH ONE CLEAR QUESTION
Discuss this outline ↗Discuss ESG Data Management and Carbon Reporting Dashboard
Share a high-level question and the type of evidence involved—not confidential records. We can discuss discovery, scope and a written way to review the work.
08 / SOURCE NOTES
Check the current public material.
These references support an initial discussion only. They do not make AIGreen Plus an accredited or certified verifier.
Public official material — not accreditation.
- GHG Protocol Corporate Accounting and Reporting Standard
Supports the bounded claim that the Corporate Standard provides requirements and guidance for corporate GHG inventories, and that Scope 2 Guidance addresses purchased or acquired electricity, steam, heat and cooling.
- GHG Protocol Corporate Value Chain (Scope 3) Standard
Supports the bounded claim that the Scope 3 Standard provides a corporate value-chain method covering 15 upstream and downstream activity categories and is intended for assessing value-chain emissions; it does not determine this client's applicability or assure results.
These official GHG Protocol pages support the service's high-level corporate Scope 1–2 and value-chain Scope 3 method references only. They do not establish Malaysian legal or reporting obligations, select factors for a particular site, or replace qualified review and any required external verification.
Dashboards and numerical scenarios are fictional planning examples. The services are proposed consultancy scopes, not certification, accreditation, assurance, legal advice, regulatory approval or a promise of emissions, cost, staffing, safety, quality or market outcomes.
