


OPERATIONS, PRODUCTION & MANAGEMENT / WORKFLOW 07
AI Production Yield & Waste Analysis
See where material becomes waste. Review better batch evidence.
AIGreen Plus can scope a review workflow that reconciles material input, good output and recorded waste by batch, then drafts exception views for your operations team. Calculations, data access, standards and improvement actions remain subject to discovery, qualified review and written approval.
Human review retainedIntegration subject to discoveryFictional dashboard concept
See the dashboard concept ↓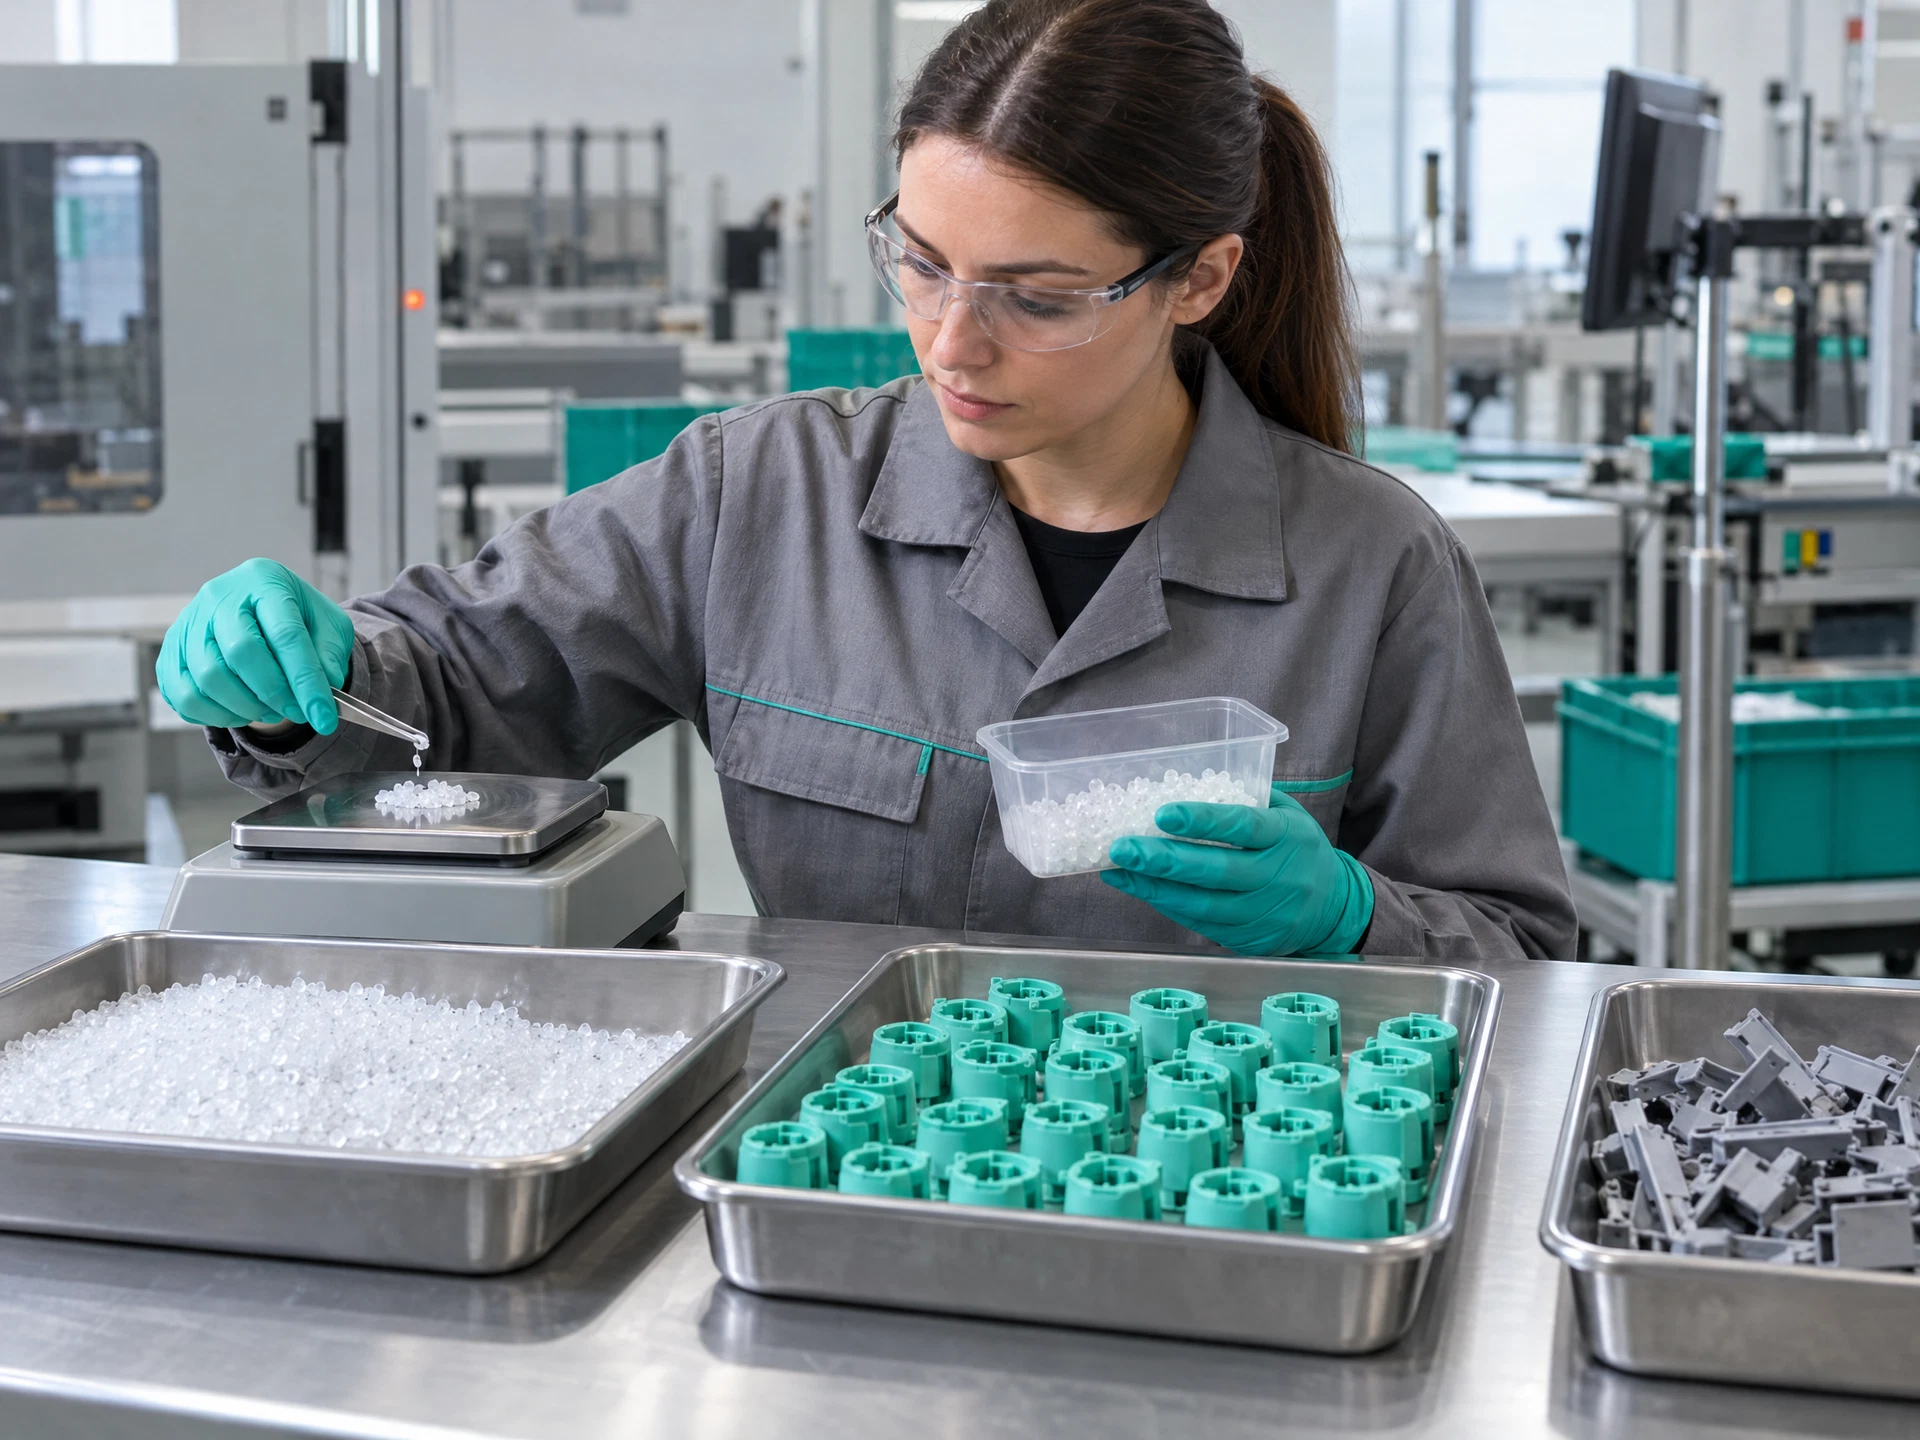
Image status: generating — final scene not yet confirmed.
This workflow compares material issued to a batch with its good output and recorded waste, helping Malaysian manufacturers prioritise unusual yield-loss records for investigation. It can accept approved exports or structured sheets and produce reconciled calculations, batch comparisons and a draft exception brief. A production or process-qualified reviewer must confirm units, standards, context and root cause; the workflow does not change settings, release product or make a final improvement decision.
01 / SEE THE OUTPUT
Batch Yield and Waste Review
FICTIONAL SAMPLE / four anonymised batch records, one production week. A clear view of the records, calculations and exceptions your team may need to review.
PROPOSED DASHBOARD CONCEPT
FICTIONAL SAMPLE / four anonymised batch records, one production weekBatch Yield and Waste Review
Recorded waste by sample batch
Fictional sample values · Three fictional rows; no benchmark or outcome.
Unit: kg
| Sample batch | Input material (kg) | Good output (kg) | Recorded waste (kg) | Yield (%) |
|---|---|---|---|---|
| Batch A | 1200 | 1080 | 120 | 90 |
| Batch B | 950 | 826.5 | 123.5 | 87 |
| Batch C | 1100 | 1012 | 88 | 92 |
| Batch D | 1000 | 840 | 160 | 84 |
AI-assisted draft / requires verification
The fictional sample compares batch input, output and waste. Batch D has the lowest yield and highest waste; Batch C has the highest yield. Review only: no cause or action is approved.
02 / THE WORKFLOW
Five steps, with an accountable owner.
The example separates deterministic checks from AI-assisted drafts, exceptions and decisions.
- 01↓
Define the comparison basis
Confirm units and boundariesAgree measures for input, output, waste and yield.
OWNER / CONTROLOperations lead / approval - 02✓
Gather source records
Collect approved recordsCollect material, output and waste records by batch.
OWNER / CONTROLProduction control / owner - 03≡
Reconcile quantities
Check timing and duplicatesCheck units, missing, duplicate and unmatched quantities.
OWNER / CONTROLProduction analyst / control - 04◎
Review unusual loss
Prioritise investigationCompare yield and waste against an agreed reference.
OWNER / CONTROLProcess engineer / reviewer - 05↗
Approve improvement brief
Document action and ownerRecord verified exceptions and proposed tests for approval.
OWNER / CONTROLOperations manager / approval
If a check fails: Hold the record for its owner, correct the source and preserve the approved manual fallback.
03 / RESPONSIBILITIES
Automate the repetition. Keep the judgment.
| Task | Manual today | Proposed assistance | Human review / owner |
|---|---|---|---|
| Match input to output and waste | Join tickets and sheets; chase gaps. | Normalise fields; draft reconciliation. | Verify boundaries, units and gaps. |
| Calculate yield and waste | Copy formulas and rebuild tables. | Apply formulas; draft summary. | Approve definitions and exclusions. |
| Spot loss patterns | Scan for high-loss batches. | Rank deviations against reference. | Investigate recipe, grade, rework and context. |
| Prepare improvement follow-up | Compile findings into notes. | Draft exception brief and questions. | Approve trials, owners and controls. |
Make loss patterns visible
Use a consistent input-to-output comparison.
Create a reconciled base
Set missing, duplicate and unit rules first.
Prioritise investigation
Draft a ranked queue without declaring cause.
Turn findings into actions
Link verified exceptions to an owner and next decision.
04 / TRANSPARENT FIGURES
Show the working behind the claim.
These numbers show one hypothetical calculation method. They are not customer evidence.
HYPOTHETICAL WORKED EXAMPLE / NOT CUSTOMER RESULTS
45 → 25 combined labour minutes for the same task.
20 one batch yield-and-waste comparison pack units per month × 20 minutes less per unit.
7 → 3 per 100 checked error-affected administrative entries, not incidents/accidents/disease/product defect outcomes (4.0 percentage points).
See assumptions and calculations
| Measure | Illustrative calculation | Meaning and limit |
|---|---|---|
| Labour effort | (45 − 25) ÷ 45 × 100 = 44.4% | Same workload and expected review quality; includes ongoing exception checks as scoped. |
| Time capacity | (45 − 25) × 20 ÷ 60 = 6.7 hours | Released time is not payroll savings or guaranteed job reduction. |
| Admin checks | (7 − 3) ÷ 100 = 4.0 percentage points; 57.1% relative | Hypothetical administrative check: 7 versus 3 affected entries per 100; not a safety, product-quality or operational-outcome guarantee. |
Hypothetical same-workload illustration: 20 monthly packs, unchanged source quality and equivalent qualified review. Manual checking takes 45 minutes per pack; a bounded draft takes 25 minutes, including review and exceptions.
Scenario figures are illustrative arithmetic, not benchmarks, forecasts, actual customer results or guarantees. Measure a like-for-like pilot with the same definitions before making a claim.
05 / PROPOSED DELIVERY
Scope one process, then measure it.
Map the evidence
Map material, output, waste, standards, owners, units and batch keys.
What you receiveData map and scope noteReconcile a sample
Test balances, exclusions and missing records on an anonymised sample.
What you receiveReconciliation table and exception rulesDesign the review pack
Prepare calculations, comparison views and approval checkpoints.
What you receivePilot pack and test checklistHandover controls
Document ownership, fallback, change control, training and support.
What you receiveHandover checklist and operating notes06 / BEFORE YOU INVEST
Inputs, boundaries and ownership should be clear.
What to prepare
- Material issue, return and transfer records with batch, date, quantity and unit; owner: production control.
- Good-output records by batch and shift; owner: production supervisor.
- Waste, scrap and rework records with reason and quantity; owner: production or QA.
- Approved BOM, recipe or yield standard with revision; owner: process engineering or QA.
- Batch calendar, line, grade, changeover context and export metadata; owner: planning or data steward.
What to agree in writing
- Reconcile and flag only; authorised operations and QA decide cause, disposition and process changes.
- Use anonymised, least-necessary records; exclude operator identifiers. Written Malaysian privacy and security review sets access and retention.
- Never auto-change settings, release or hold product, classify compliance, or update inventory or finance records.
- Document units, standards, missing-data and duplicate rules, with evidence and manual fallback.
- Interfaces, testing, licences, training, refresh, support and cost require written agreement; dashboard is fictional, not evidence or guarantee.
Confidence comes from traceable evidence.
Define the baseline and acceptance criteria before a pilot, trace outputs to approved sources, record review and exception effort, and make a scale/revise/stop decision with the process owner.
07 / CLEAR ANSWERS
10 questions. Practical answers.
Clear answers
Frequently asked questions.
Ten workflow-specific questions on scope, integration feasibility, controls, costs and measurement.
What does this yield and waste workflow take in and produce?
It compares material input with good output and waste by batch. Output is a reconciled table, yield and waste calculations, comparison view and exception brief. Production or QA reviewers confirm interpretation before action.
Can it work with our existing ERP, MES or spreadsheets?
Scope can use approved exports, shared files or existing interfaces, subject to access, field quality and testing. This record claims no ready-made connector. Written design defines import method, refresh cadence, fallback and owner.
What should we prepare for an initial assessment?
Prepare anonymised material issue, output, waste and rework records with units, batch keys and dates. An approved recipe, BOM or yield basis helps. Include owners and exclusions; do not send unnecessary employee or customer identifiers.
Who is responsible for approving an apparent yield loss?
A qualified production reviewer verifies quantities, units, standard revision, rework and context, with QA involvement. An authorised operations manager decides whether to investigate or trial; the workflow cannot approve that decision.
What do the illustrative labour figures mean, and how would we measure them?
They are hypothetical administrative time for one comparison pack, including review—not payroll savings, job elimination or throughput. Measure actual minutes, record quality and review effort across a consistent sample before and after.
Are the dashboard numbers or scenario figures actual customer results?
No. Rows, chart, metrics and scenario are fictional illustrations, not customer evidence, benchmarks, measured waste reductions or guarantees. Your team must validate its records and approve the comparison basis first.
How would security, access and privacy be handled in Malaysia?
Use least-necessary anonymised records with access, retention, export and deletion rules agreed in writing. A qualified Malaysian privacy and security review should confirm your arrangement; this is not a compliance certification or legal determination.
How quickly can a yield-analysis milestone be delivered?
Timing depends on source readiness, sample quality, approvals, interfaces, testing and product variants. Set milestones after discovery. No fixed duration is promised; manual analysis can continue while design is reviewed.
What affects the quotation and recurring cost?
Quotation depends on data preparation, interfaces, refresh frequency, products, rules, testing, training, hosting, licences and support. Recurring costs and change-control fees require written proposals; no price is implied in this record.
Who owns the workflow after handover, and is 24/7 support included?
Your operations or data owner should own definitions, source quality, approvals and decisions, with a technical maintenance contact. Support hours, response targets, monitoring, retraining and escalation require written service terms; 24/7 coverage is not promised.
START WITH ONE REPEATABLE TASK
Discuss the workflow ↗Discuss Production Yield & Waste Analysis for your operation.
Share the process and the type of information involved—not confidential records. We can discuss discovery, access boundaries and an agreed way to measure a scoped pilot.
New AI-created images are fictional scenes; the production-reporting photograph is licensed Pexels stock. None depicts actual AIGreen Plus staff, clients, facilities, workflows or results.
All dashboard values and benefit scenarios are fictional; the screen is not a live integration. Workflows, system access, privacy, responsibilities, licences, costs and support require written scope. No ranking, savings, staffing, safety, quality or compliance outcomes are guaranteed.
