


OPERATIONS, PRODUCTION & MANAGEMENT / WORKFLOW 05
AI Daily Production Reporting
Clear daily reports. Visible exceptions.
AIGreen Plus can help Malaysian manufacturers map shift inputs, define formulas and design a human-reviewed daily report. It may consolidate all output, downtime, rejects and manpower and flag missing fields. Discovery and implementation require written agreement.
Human review retainedIntegration subject to discoveryFictional dashboard concept
See the dashboard concept ↓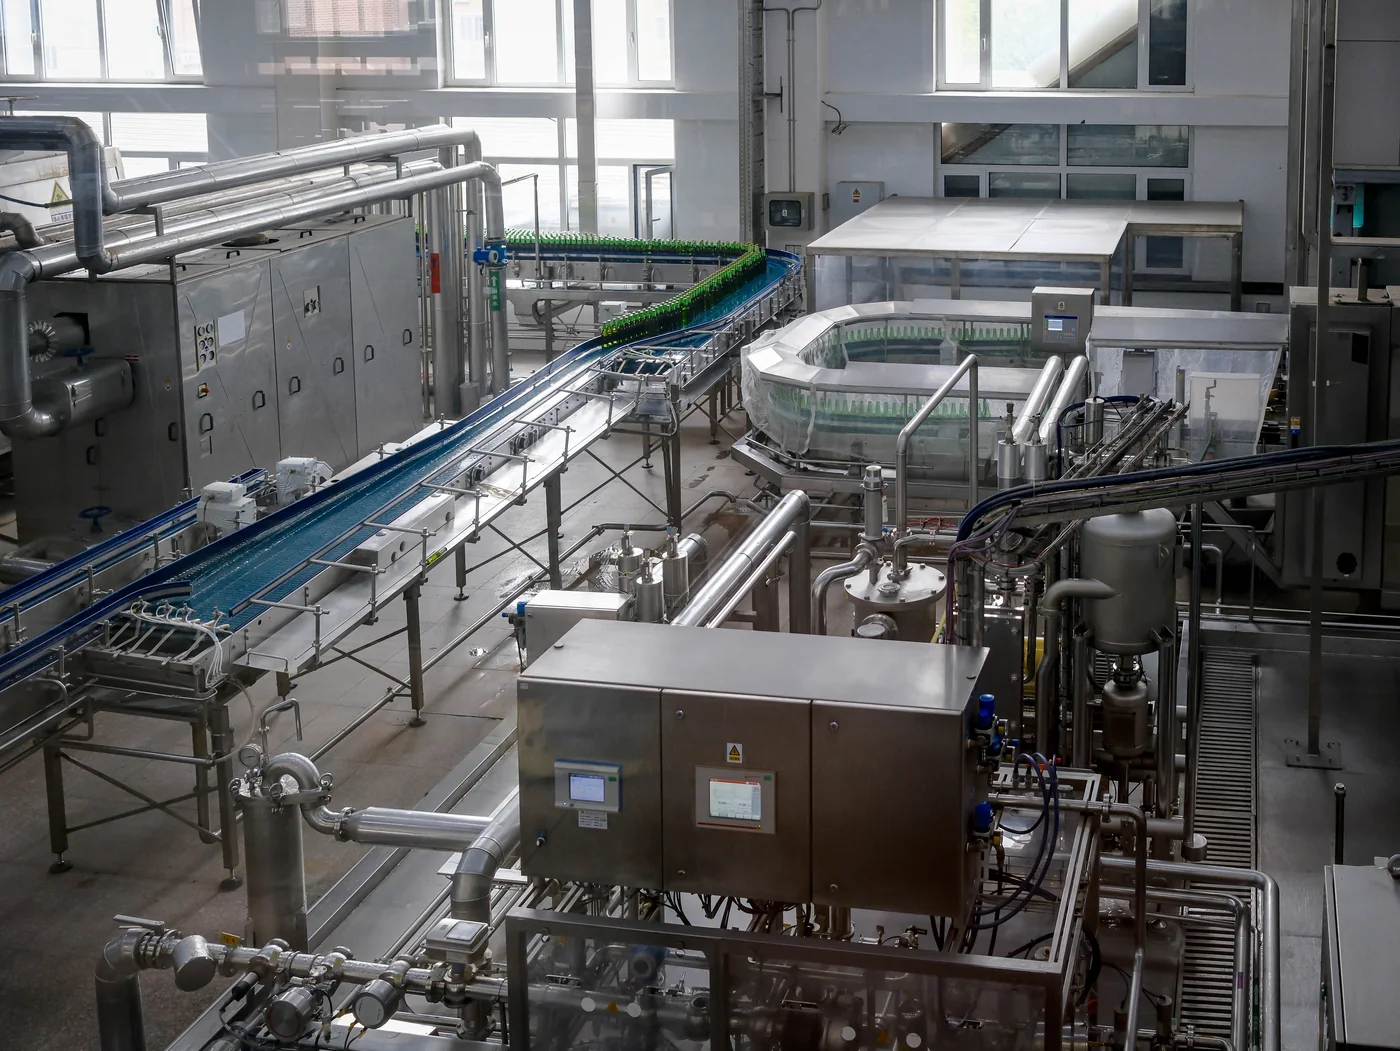
Photo by BI ravencrow via Pexels. Pexels licence.
AI Daily Production Reporting helps teams bring approved output, downtime, rejects and manpower records into one draft report for management review. AIGreen Plus can help scope source fields, checks, dashboard and approval route for a Malaysian factory. Output is a traceable summary with exceptions, not an unattended operating decision. Supervisors and authorised managers verify corrections, investigate entries and release communication while a manual fallback remains available.
01 / SEE THE OUTPUT
Daily Reporting Review Dashboard
FICTIONAL SAMPLE / daily report. A clear view of the records, calculations and exceptions your team may need to review.
PROPOSED DASHBOARD CONCEPT
FICTIONAL SAMPLE / daily reportDaily Reporting Review Dashboard
Downtime by area
Fictional sample values · Fictional values only; not a performance trend.
Unit: minutes
| Area / shift | Reported output (units) | Downtime (min) | Rejects (units) | Manpower (people) |
|---|---|---|---|---|
| Pressing / Day | 1240 | 35 | 8 | 3 |
| Assembly / Day | 980 | 20 | 5 | 4 |
| Packing / Day | 760 | 15 | 3 | 2 |
AI-assisted draft / requires verification
Draft only: 2,980 units, 70 downtime minutes and 16 rejects; review source trace before communication.
02 / THE WORKFLOW
Five steps, with an accountable owner.
The example separates deterministic checks from AI-assisted drafts, exceptions and decisions.
- 01↓
Collect approved inputs
Receive daily recordsLoad approved output, downtime, rejects and manpower.
OWNER / CONTROLSource owners - 02✓
Check completeness
Check missing or duplicate fieldsCheck dates, areas and duplicates without changing source data.
OWNER / CONTROLAnalyst / checklist - 03≡
Consolidate daily figures
Apply approved formulasGroup areas and calculate approved indicators.
OWNER / CONTROLWorkflow owner - 04◎
Prepare exception draft
Queue exceptionsQueue missing fields and mismatches with sources.
OWNER / CONTROLAI draft / supervisor - 05↗
Review and release
Authorised approvalReviewer corrects exceptions and approves communication.
OWNER / CONTROLProduction manager
If a check fails: Hold the record for its owner, correct the source and preserve the approved manual fallback.
03 / RESPONSIBILITIES
Automate the repetition. Keep the judgment.
| Task | Manual today | Proposed assistance | Human review / owner |
|---|---|---|---|
| Gather shift output | Supervisors copy figures from sheets and messages. | Proposed intake collects approved fields in one draft. | Source owner confirms figures and corrections. |
| Record downtime | An administrator re-keys durations and reasons. | Checks group durations and flag incomplete reasons. | Line lead verifies duration against the record. |
| Combine rejects and manpower | Separate totals are reconciled by hand. | Draft calculates totals and shows references. | Production and quality owners confirm corrections. |
| Prepare management report | Coordinator formats, chases explanations and emails a version. | Bounded draft assembles dashboard and review queue. | Production manager approves wording and follow-up. |
One agreed daily view.
Map approved production fields into one traceable report.
Make reconciliation visible.
Use documented formulas and references to flag mismatches.
Put follow-up in the open.
Separate review items from routine totals before release.
Measure the same work fairly.
Agree a baseline for labour, review and administrative errors.
04 / TRANSPARENT FIGURES
Show the working behind the claim.
These numbers show one hypothetical calculation method. They are not customer evidence.
HYPOTHETICAL WORKED EXAMPLE / NOT CUSTOMER RESULTS
180 → 60 combined labour minutes for the same task.
22 one daily production reporting cycle units per month × 120 minutes less per unit.
8 → 3 per 100 checked error-affected administrative entries per 100 cycles, not incidents, accidents, disease or product defects (5.0 percentage points).
See assumptions and calculations
| Measure | Illustrative calculation | Meaning and limit |
|---|---|---|
| Labour effort | (180 − 60) ÷ 180 × 100 = 66.7% | Same workload and expected review quality; includes ongoing exception checks as scoped. |
| Time capacity | (180 − 60) × 22 ÷ 60 = 44.0 hours | Released time is not payroll savings or guaranteed job reduction. |
| Admin checks | (8 − 3) ÷ 100 = 5.0 percentage points; 62.5% relative | Hypothetical administrative check with the same workload and review standard; not a safety, product-quality, compliance or outcome guarantee. Actual measurement needs a baseline and human review. |
Hypothetical comparison: 3 staff × 60 minutes = 180 labour minutes before; 3 × 20 = 60 after, including review and exceptions, for 22 cycles/month. Same workload and quality; released time is not payroll savings or job elimination.
Scenario figures are illustrative arithmetic, not benchmarks, forecasts, actual customer results or guarantees. Measure a like-for-like pilot with the same definitions before making a claim.
05 / PROPOSED DELIVERY
Scope one process, then measure it.
Map one reporting cycle
Document sources, owners, cut-off, re-keying and approvals.
What you receiveWorkflow map and baseline worksheetDefine controls and measures
Agree definitions, formulas, exceptions, access, retention, fallback and measures.
What you receiveScoped control design and acceptance measuresTest a bounded sample
Use sanitised records to test fields, duplicates, mismatches and traceability.
What you receiveReviewed sample reports and test evidenceTrain, measure and decide
Train users, compare workload and record whether to scale, revise or stop.
What you receivePilot findings and decision record06 / BEFORE YOU INVEST
Inputs, boundaries and ownership should be clear.
What to prepare
- Shift output logs by area, date and shift, from production supervisors via approved or anonymised exports.
- Downtime duration and reason fields, from line leads or the coordinator.
- Reject counts and disposition/status fields, from the QA/QC owner.
- Manpower totals by area and shift, without names unless approved, from the data steward.
- Reporting calendar, KPI definitions, escalation rules and approvals, from the operations manager.
What to agree in writing
- Draft only; authorised manager verifies corrections, resolves exceptions and releases the report.
- No machinery, product release, safety, payroll or employment decision is automated; site procedures remain primary.
- Use least-necessary data and anonymised samples; define access, retention, traceability and Malaysian privacy review.
- Interfaces are feasibility questions; reconcile sources and test acceptance first.
- Costs, licences, hosting, training, changes, maintenance and support require agreement; 24x7 is not promised.
Confidence comes from traceable evidence.
Define the baseline and acceptance criteria before a pilot, trace outputs to approved sources, record review and exception effort, and make a scale/revise/stop decision with the process owner.
07 / CLEAR ANSWERS
10 questions. Practical answers.
Clear answers
Frequently asked questions.
Ten workflow-specific questions on scope, integration feasibility, controls, costs and measurement.
What does AI Daily Production Reporting automate?
It can combine approved output, downtime, rejects and manpower, apply agreed formulas and flag missing or mismatched entries for a draft report. Sources and checks are scoped during discovery; this is a fictional concept, not a live system.
Can the workflow use our existing Excel files or ERP exports?
Possibly, subject to file structure, exports, permissions, licences and data quality. No integration is assumed; assess an export workflow first, retain manual fallback and approve scope and testing with owners before deeper interface work.
What should we prepare for an initial discussion?
Prepare an anonymised daily report, field definitions, area and shift labels, cut-off, exceptions, approval rules and source owners. Map where records are held; do not send confidential production or employee data initially.
Who is responsible for approving the daily report?
An authorised production manager checks entries, resolves exceptions and approves communication. Keep the reviewer and source trail. The workflow does not automatically release products, control machinery, change payroll or make employment decisions.
Does the example promise labour savings or fewer employees?
No. It reduces repetitive preparation for review or improvement work; it does not promise payroll savings, headcount reduction or a fixed percentage. Compare the same workload, review and exceptions against an agreed baseline.
Are the dashboard and benefit numbers actual customer results?
No. Dashboard rows and the 180-to-60 labour-minute scenario are fictional. The 22-cycle basis and administrative error example illustrate measurement, not an AIGreen Plus result or guarantee. Actual findings need an agreed baseline, pilot and review.
How will access, security and privacy be handled?
Define authorised users, least-necessary fields, access, processing locations, retention, traceability and incident escalation in writing. Use sanitised records. A qualified Malaysian adviser should review obligations; this is not a compliance or security certification.
How long would a reporting pilot take?
Timing depends on sources, access, formulas, testing, user acceptance and interfaces. Agree milestones after discovery for mapping, design, testing, training and measurement. No fixed delivery duration is promised to customers.
What affects quotation and recurring costs?
Source condition, dashboard complexity, validation, approvals, interfaces, users, licences, hosting, training and changes affect cost. Request one-off and recurring items in writing. This example implies no price, payback or guaranteed return.
What ownership and support are needed after rollout?
Agree an owner for definitions, source quality, access and changes, plus maintenance, support scope, response targets and fees. Review before expanding. Support is not automatically 24x7; no service level or outcome is promised without written agreement.
START WITH ONE REPEATABLE TASK
Discuss the workflow ↗Discuss Daily Production Reporting for your operation.
Share the process and the type of information involved—not confidential records. We can discuss discovery, access boundaries and an agreed way to measure a scoped pilot.
New AI-created images are fictional scenes; the production-reporting photograph is licensed Pexels stock. None depicts actual AIGreen Plus staff, clients, facilities, workflows or results.
All dashboard values and benefit scenarios are fictional; the screen is not a live integration. Workflows, system access, privacy, responsibilities, licences, costs and support require written scope. No ranking, savings, staffing, safety, quality or compliance outcomes are guaranteed.
